Currently, there is a plethora of commentary strongly suggesting that the U.S. economy is nowhere near recession currently.
That may very well be the case, however, by the time the data is
revised to reveal the recession it will be far too late for investors to
do anything about it. The market, a coincident indicator of
economic recessions historically, may already be revealing future
economic data revisions will eventually disclose.
With the economy now more than 6-years
into an expansion, which is long by historical standards, the question
for you to answer by looking at the charts below is:
“Are we closer to an economic recession or a continued expansion?”
How you answer that question should have
a significant impact on your investment outlook as financial markets
tend to lose roughly 30% on average during recessionary periods.
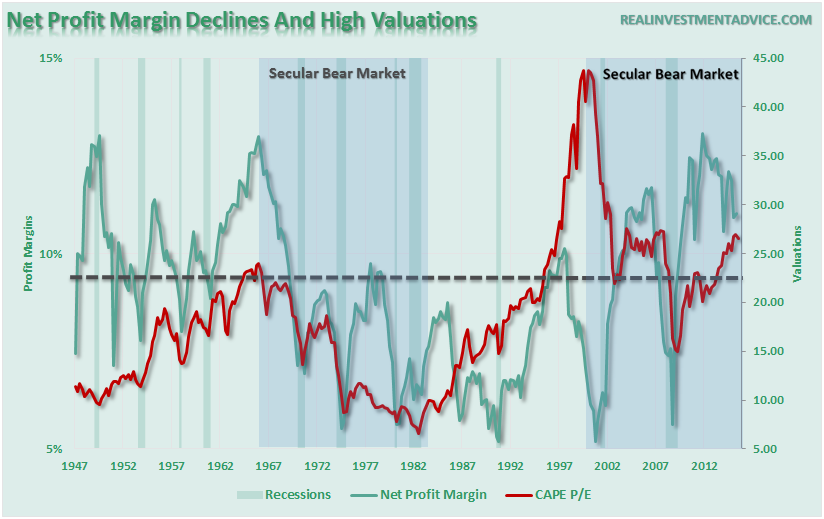
However, with margin debt at record levels, earnings deteriorating and
junk bond yields rising, this is hardly a normal market environment
within which we are currently invested.
If you have any questions, or comments, you can email me or send me a tweet: @lanceroberts
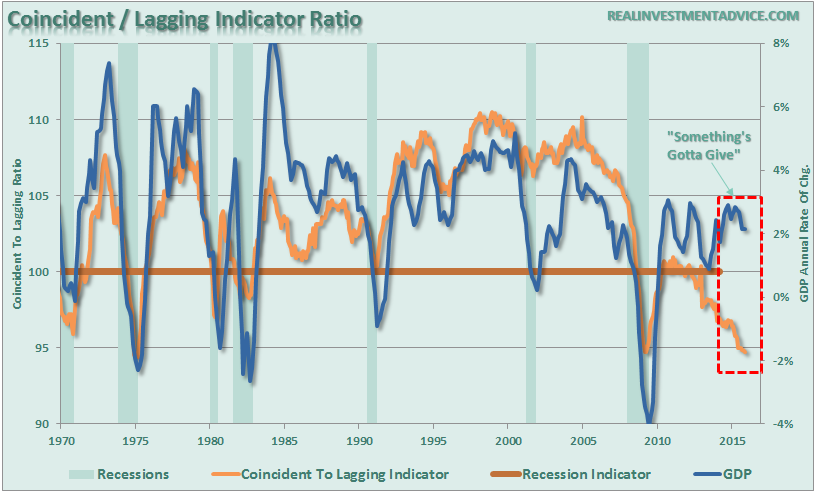
Leading Economic Indicators
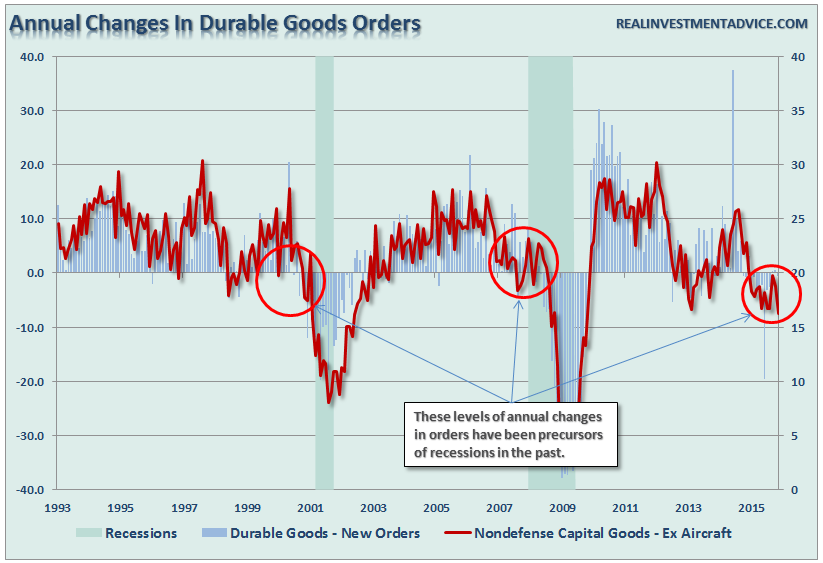
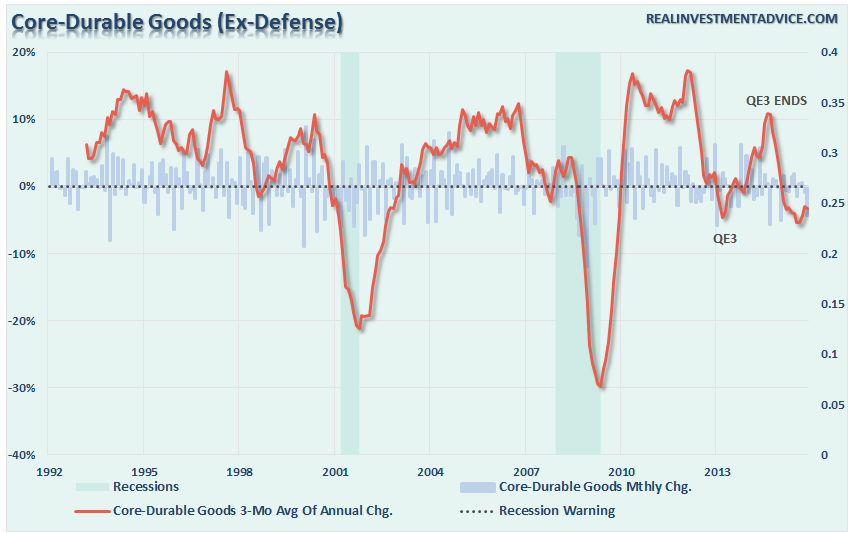
Durable Goods
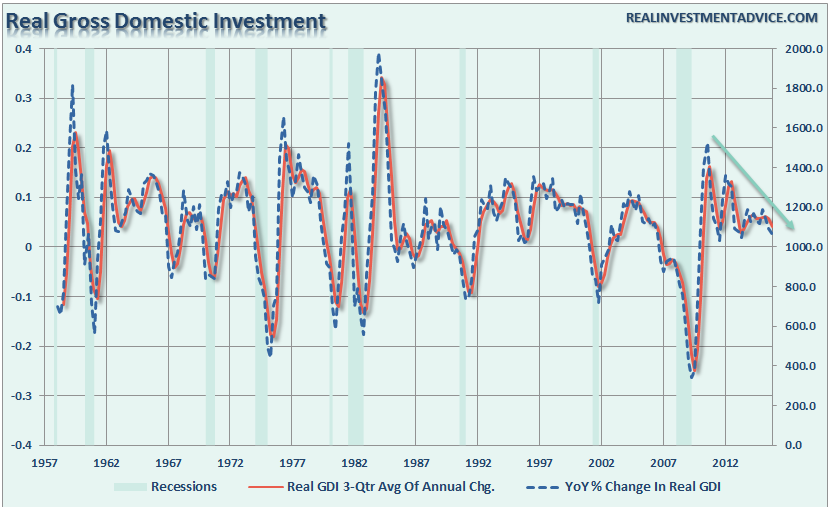
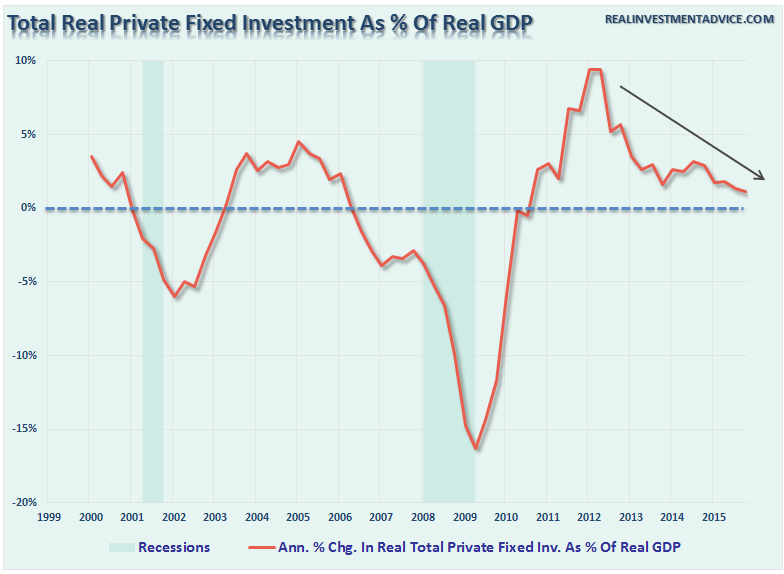
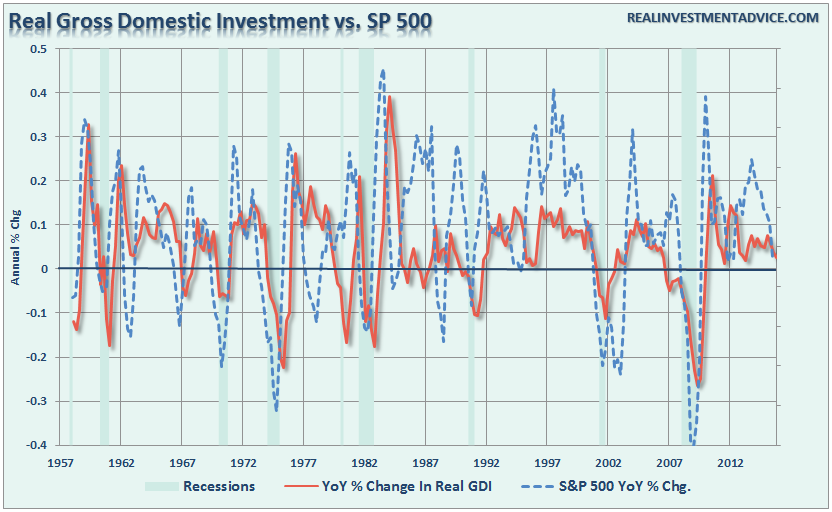
Investment
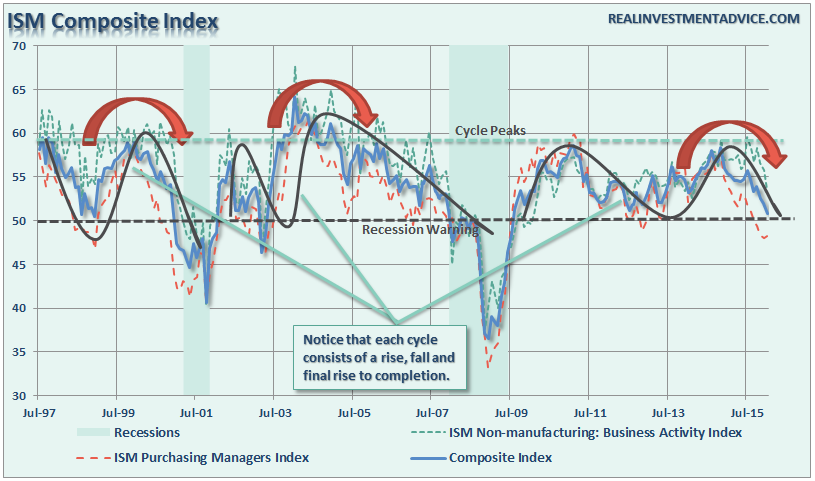
ISM Composite Index
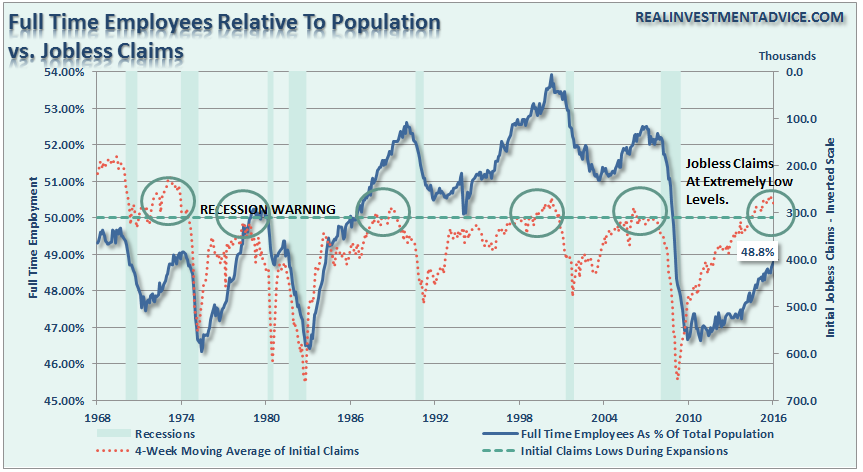
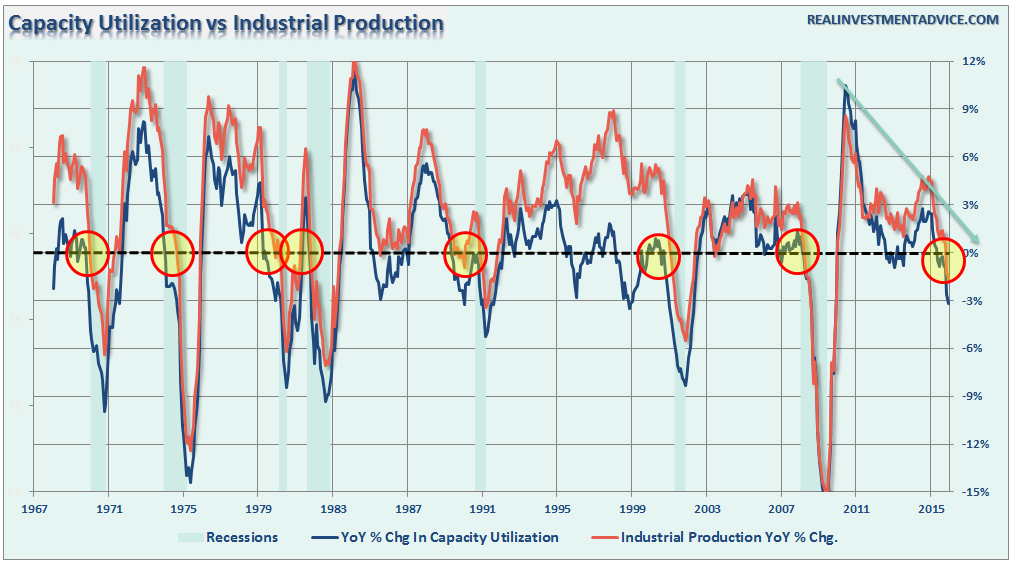
Employment & Industrial Production
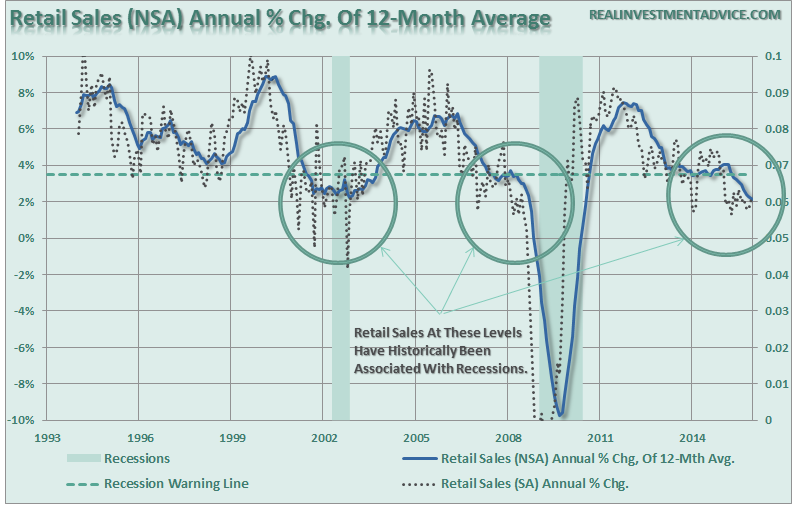
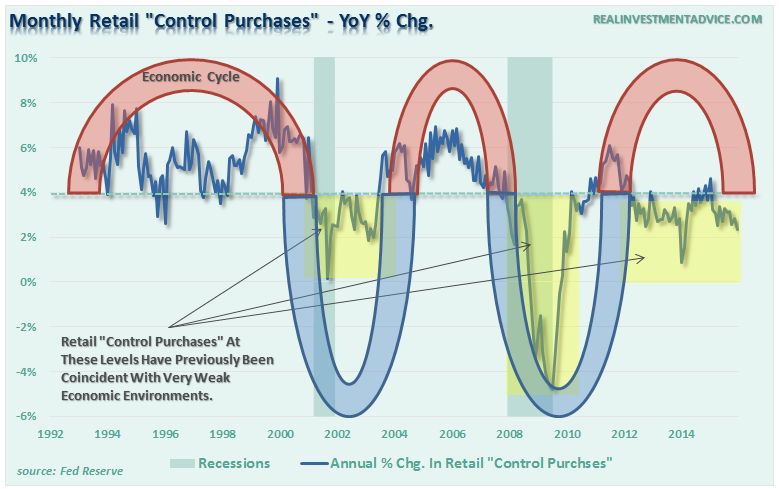
Retail Sales
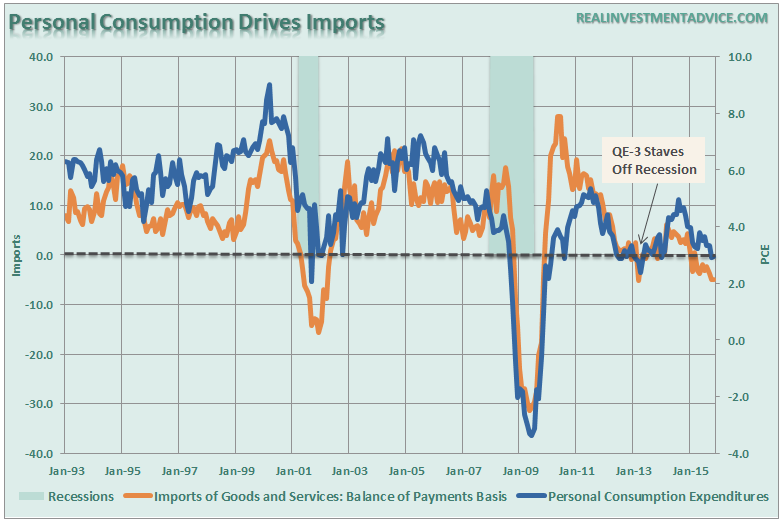
PCE & Imports
Corporate Profits As % Of GDP
The Broad View
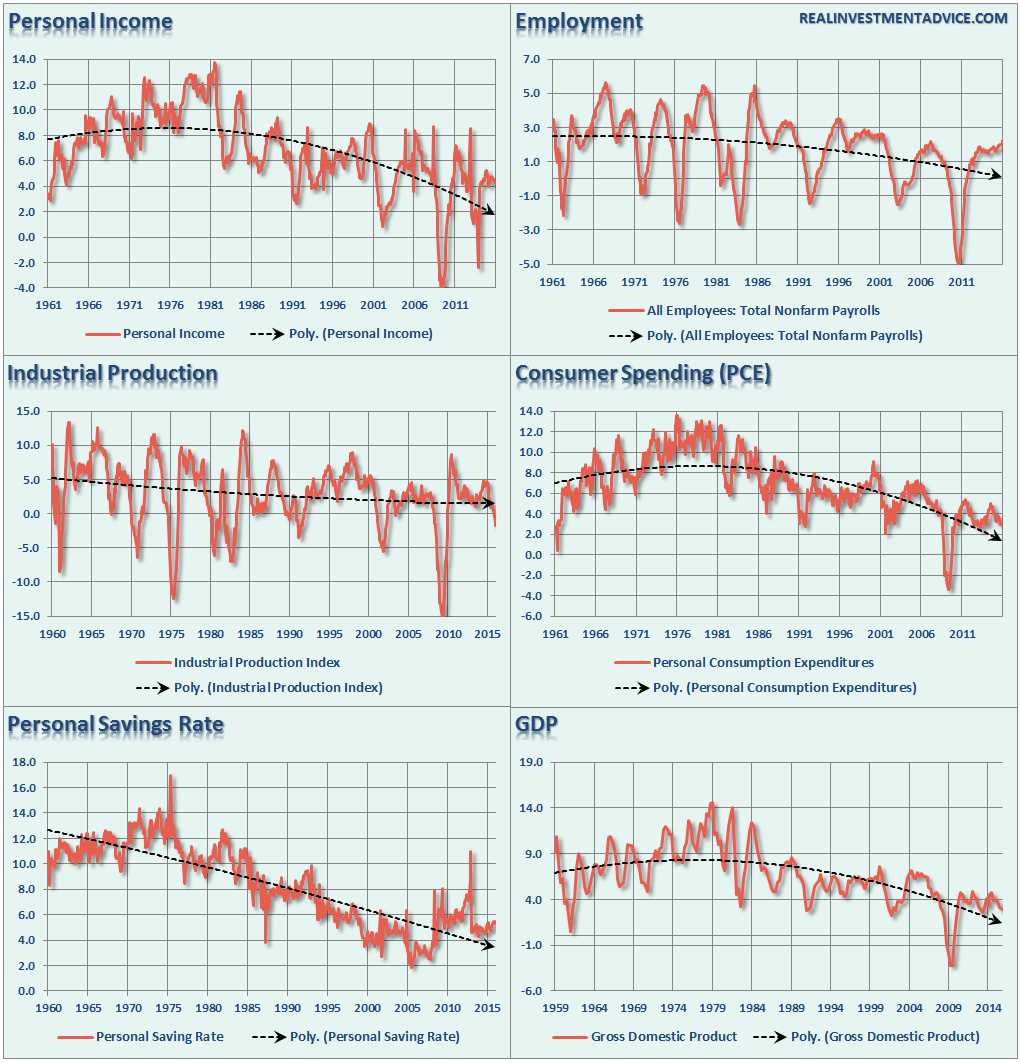
If you are expecting an economic
recovery, and a continuation of the bull market, then the economic data
must begin to improve markedly in the months ahead. The
problem has been that each bounce in the economic data has failed within
the context of a declining trend. This is not a good thing and is why
we continue to witness an erosion in the growth rates of corporate
earnings and profitability. Eventually, that erosion combined, with excessive valuations, will weigh on the financial markets.
For the Federal Reserve, these charts
make the case that continued monetary interventions are not healing the
economy, but rather just keeping it afloat by dragging forward future
consumption. The problem now is the Fed has opted, by tightening
monetary policy, to not “refill the punchbowl.” Eventually, when the drinks run out, the party comes to an end.
With the Fed hiking interest rates, and talking a tough game of continued economic strength, the risk of a “policy error” has risen markedly in recent months. The markets, falling inflation indicators, and plunging interest rates are all suggesting the same.
Lance Roberts

Lance Roberts is a Chief Portfolio Strategist/Economist for Clarity Financial. He is also the host of “The Lance Roberts Show” and Chief Editor of the “Real Investment Advice” website and author of “Real Investment Daily” blog and “Real Investment Report“. Follow Lance on Facebook, Twitter and Linked-In
No comments:
Post a Comment