by
Chris Martenson
Every year or two we update this report, which lays out the investment thesis for gold. Here is this year’s version.
Silver is touched upon only as necessary; as a separate report of equal scope is required for that precious metal.
Gold is one of the few investments that every investor should
have in their portfolio. We are now at the dangerous end-game period of a
very bold but very reckless & disappointing experiment with the
world’s fiat (unbacked) currencies. If this experiment fails — and we
observe it’s in the process of failing — gold will provide one of the
best forms of wealth insurance. But like all insurance products, it only
works if you buy it before you need to rely on it.
Risky Markets
As the world’s central banks perform increasingly bizarre
and desperate maneuvers to keep the financial system from falling apart,
the most frequently asked question we receive is:
What should I do?
Unfortunately, there’s no simple
answer to that question. Even seasoned pros running gigantic funds are
baffled by the unusual set of conditions created by 4 decades of
excessive borrowing and 7 years of aggressive money printing by central
banks. We expect market conditions to be even more perilous in 2016 as
they are here in December 2015. Worse, we fear a major market correction
— if not a financial/banking accident of historic proportions — could
easily happen in the not too distant future.
In short: this is a dangerous time for investors. At a time like
this, we believe it’s prudent to focus more on protecting one’s wealth
rather than gambling for capital gains.
The Opportunity In These Strange Times
In 2001, as we witnessed the painful end of the long stock bull
market, like many of you I imagine, I began to grow quite concerned
about my traditionally-managed stock and bond holdings. Other than a
house with 27 years left on a 30-year mortgage, these paper assets
represented 100% of my investing portfolio.
So I dug into the economic data to discover what the future likely held. What I found shocked me. The insights are all in the
Crash Course, in both video and book form, so I won’t go into all of that data here. But one key takeaway for me was:
the
US and many other governments around the world are spending far more
than they are taking in, and are supporting that gap by printing a whole
lot of new money.
By 2002, I had investigated enough about our monetary, economic, and
political systems that I came to the conclusion that holding gold and
silver would be a very good idea for protecting the purchasing power of
my financial wealth from all this money printing. So took an extreme
step: I poured 50% of my liquid net worth into precious metals at that
time, and sat back and waited.
Despite the ups and downs in the years that followed — years of ups
until 2011, years of down since — that move has still turned out to be a
very sound investment for me. And I forecast the best is yet to come
for precious metals holders like me.
But part of my is depressed by that conviction. Why? Because the
forces that are going to drive the price of gold (and silver) higher are
the very same trends that are going to leave most people on the planet
financially much worse off than they are now.
Here at
PeakProsperity.com,
we admit that we initially were utterly baffled that the vicious
secular decline in the price of gold began at almost the exact same time
that the US Federal Reserve announced the largest and most aggressive
money printing operation in all of history – known as QE3 – which pumped
over $1.7 trillion into the financial system between 2012-2014,
throwing an astonishing $85 billion dollars of newly created ‘thin air’
money into the financial system every month!
Such an unprecedented and excessive act of monetary desperation
should have sent gold’s price to the moon; but in fact, the opposite
happened. Strange times.
As we’ll soon explain, even as the price of gold futures were being
relentlessly driven down in the US paper markets, the purchase of
physical gold by China exploded. It’s as if the West suddenly decided
gold wasn’t worth owning. Strange times, indeed.
As we’ll now explain in detail, we are witness to an incredibly
aberrant moment in financial history — one where the price of gold is
extremely undervalued relative to its true value. And similarly, many
paper assets are overvalued well-above their intrinsic worth. The
dichotomy of this moment in time is likely not to be repeated in our
lifetimes; and those who understand the fundamentals accurately have the
opportunity to position themselves now to benefit greatly (or at least,
to not be impoverished) as this extreme imbalance corrects, as it must.
Why Own Gold?
The reasons to hold gold (and silver) — I mean physical bullion here —
are pretty straightforward. Let’s begin with the primary ones:
- To protect against monetary recklessness
- As insurance against the possibility of a major calamity in the banking/financial system
- For the embedded ‘option value’ that will pay out handsomely if gold is re-monetized
Reason No. 1: To Protect Against Monetary Recklessness
By ‘
monetary recklessness,’ we mean the creation of
more money out of thin air than the productive economy actually needs or
can use. The central banks of the world have been doing this for
decades, but it has kicked into high gear ever since the onset of the
2008 financial crisis.
In our system money is created out of thin air. It is created when a
bank lends you money for a mortgage and it is created when the Federal
Reserve buys a trillion dollars’ worth of mortgages from the banks. If
you didn’t know that money was ‘loaned into existence’ then you should
really watch (or read) those parts of the Crash Course that explain the
significance of this process.
Since 1970 the US has been compounding its total credit market debts
at the astounding rate of nearly 8% per annum which gives us a chart
that swoops into the air, and which reveals an astonishing 39-fold
expansion since 1970 to nearly $60 trillion dollars:
Why is this astonishing? Isn’t it true that our economy has expanded
tremendously since 1970, as well? After all, if our economy has expanded
by the same amount, then the advance is not astonishing at all.
But sadly, the economy, as measure by Gross Domestic Product, or GDP,
has grown by less than half as much over the same time frame:
Where credit zoomed from $1.5 trillion to $59 trillion, GDP only
advanced from $1.1 trillion to $18 trillion. In other words, debt has
been growing far faster than real things that have real value. (And to
make things worse, as we explain in
Chapter 18 of the Crash Course, GDP numbers are artificially overstated. The debt figures, sadly, are not.)
The crazy part of this story is that the financial and monetary
system are so addicted to exponential expansion that they literally
threaten to collapse violently if that growth ceases or even slows.
Remember 2008 and 2009, back when the financial world seemed to be
ending? Well, collapse was a very real possibility and here’s what
almost caused that:
Anything other than smooth, continuous, exponential growth at a pace
faster than GDP seems to be a death knell for our current over-indebted
system of finance. If you are like us, you see the problem in that
right away.
The short version is this:
Nothing can grow exponentially forever. But our credit system not only wants to, but has to. Or else it will collapse.
This desperate drive for continuous compounding growth in money and
credit is a principal piece of evidence that convinces us that hard
assets — of which gold is perhaps the star representative for the
average person — are an essential ingredient in a crash-proof portfolio.
Back to our main narrative: because all money is loaned into
existence, the next thing we should be wondering is where’s all the
money that was created when those loans were made? We’d expect it to
mirror credit creation in shape.
What we find, unsurprisingly, is another exponential chart. This time
of the money supply (of zero maturity, or MZM in banker parlance):
Money is a
claim on real things, which you buy with it.
Money is no good all by itself; it’s useful because you can buy a car
with it, or land, or groceries, or medical services. Which is why we
state that money is a claim on
goods and services.
Debt, on the other hand, is a claim on
future money.
Your mortgage is your debt, and you satisfy that debt by paying out
money, in the future. That’s why we say that debt is a claim on future
money.
By now you should be thinking about how important it is that money
and debt grow at the same rate as goods and services. If they grow at a
slower rate, then there won’t be enough money and credit to make
purchases, and the economy would thus contract.
But it’s equally important that money and credit do not grow faster
than goods and services. If they do, then there will be too much money
chasing too few real things, which causes prices to rise. That’s
inflation.
Here’s the punch-line:
Since 1980, money and credit have been growing at more than twice the rate of real things. There’s
far more money and debt in the economy than there is real “stuff” all
that paper is laying claim to. Worse, the system seems addicted to
forever growing its debts faster than its income (or GDP) — a
mathematical impossibility any 4th grader can point out.
This is a dangerously unstable system. And it’s going to either
crumble slowly for a long time — or violently explode at some point.
This isn’t an opinion, it’s just math.
The Federal Reserve has created and nourished a monster. It simply
does not know how to begin starving the beast without it turning on the
hand that feeds it, and thus destroying huge swaths of so-called paper
“wealth” along with the actual economy.
So the Fed and its central bank brethren just keep pumping more and
more money into the syste, fueling ever-higher levels of debt while
hoping for an outcome that is simply impossible.
Negative Real Interest Rates
Real interest rates are deeply negative (meaning
that the rate of inflation is higher than Treasury bond yields). Even
more startling, there are trillions of dollars worth of sovereign debt
that has negative nominal yields. This means that investors
pay
various governments to take their money from them for periods as long
as seven years. For example, at the time of this writing in late 2015,
$1,000 loaned to the German government for 5 years will pay back $980 at
the end of those five years. That’s insane. Or at least, a very new
wrinkle that we have yet to determine how it will alter investor
decisions and psychology.
Negative interest rates are a forced, manipulated outcome courtesy of
central banks. Of course, the true rate of inflation is much higher
than the officially-reported statistics by at least a full percent or
possibly two; and so I consider real bond yields to be far more negative
than is currently reported.
Historically, periods of negative real interest rates are nearly
always associated with outsized returns for commodities, especially
precious metals. If and when real interest rates turn positive, I will
reconsider my holdings in gold and silver but not until then. That’s as
close to an absolute requirement as I have in this business. Recently
commodities have been hard-hit, declining in price by large amounts. So
negative interest rates are giving us different results this time than
we’d expect…so far.
Dangerous Policies
Monetary policies across the developed world remain as accommodating
as they’ve ever been. Even Greenspan’s 1% blow-out special in 2003 was
not as steeply negative in real terms as what Bernanke engineered over
his more recent tenure. Janet Yellen has extended those polices along
with the help of foreign central banks into extreme, never-before-seen
territory that now includes negative
nominal interest rates!
As mentioned above, this means people are paying governments for the
‘privilege’ of lending those same governments their money.
But it is the highly aggressive and ‘alternative’ use of the Federal
Reserve’s balance sheet to prop up insolvent banks and to sop up extra
Treasury debt that really has me worried. There seems to be no end to
these ever-expanding programs, and they seem to have become a permanent
feature of the economic and financial landscape. In Europe, the European
Central Bank (ECB) is aggressively expanding its balance sheet. In
Japan we have Prime Minister Abe’s ultra-aggressive policy of doubling
the monetary base in just two years. Suffice it to say that such grand
experiments have never been tried before, and anyone that has the vast
bulk of their wealth tied up in financial assets is making an explicit
bet that these experiments will go exactly as planned. Who in their
right mind thinks it will?
Reason No 2: To Protect Against a Major Banking Failure
Reason #2,
insurance against a major calamity in the banking system, is an important part of my rationale for holding gold.
And let me clear: I’m not referring to “paper” gold, which includes
the various tradable vehicles (like the “GLD” ETF) that you can buy like
stocks through your broker. I’m talking about physical gold and silver
(coins, bars, etc). Its their unusual ability to sit outside of the
banking/monetary system and act as monetary assets that appeals to me.
Literally everything else financial, including the paper US bills in
our wallets and purses, is simultaneously somebody else’s liability.
But gold and silver bullion are not. They are simply — boringly, perhaps
— just assets. This is a highly desirable characteristic that is not
easily replicated in today’s world of ‘money.’
Should the banking system suffer a systemic breakdown — to which I
ascribe a reasonably high probability of greater than 1-in-3 over the
next 5 years — I expect banks to close for some period of time. Whether
it’s two weeks or six months is unimportant. No matter the length of
time, I’d prefer to be holding gold than bank deposits if/when that
happens.
What most people don’t know is that the banking crisis in Cyprus in
2013 ushered in an entirely new set of rules as well as a new financial
term: the “bail-in.” Where a bail-out uses taxpayer funds to
re-capitalize a failed bank, a bail-in uses internal assets to
accomplish that task. Which ‘internal assets?’ Bank deposits, as in
the accounts regular people like you hold at your bank. Even worse, the
new rules adopted within the US specifically call for the derivative
bets made between banks to have seniority over bank deposits when it
comes to a bail-in restructuring event. That means that the money you
hold in your bank account will be used to pay off any and all reckless
bets your bank may have made with another financial entity via
derivative bets. And US banks hold a LOT of derivatives on their books
right now.
During a banking holiday, your money will be frozen and left just
sitting there, even as everything priced in money (especially imported
items) rockets up in price. By the time your money is again available to
you, you may find that a large portion of it has been looted by the
effects of a collapsing currency. How do you avoid this? Easy: keep some
‘money’ out of the system to spend during an emergency. We advocate
three months of living expenses in cold, hard cash; but you owe it to
yourself to have at least a little gold and silver in your possession as
well.
The test run for such a bank holiday recently played out in Cyprus
where people woke up one day and discovered that their bank accounts
were frozen. Those with large deposits had a very material percentage of
those funds seized so that the bank’s more senior creditors, the
bondholders, could avoid the losses they were due. Sound fair to you? Me
neither.
Most people, at least those paying attention, learned two things from Cyprus:
- In a time of crisis, those in power will do whatever it takes to
assure that the losses are spread across the population rather than be
taken by the relatively few institutions and individuals responsible for
those losses.
- If you make a deposit with a bank, you are actually an unsecured
creditor of that institution. This means you are legally last in
line for repayment should that institution fail.
Reason No. 3 – Gold May Be Re-monetized
The final reason for holding gold,
because it may be remonetized,
is actually a very big draw for me. While the probability of this
coming to pass may be low, the rewards would be very high for those
holding gold should it occur.
Here are some numbers: the total amount of ‘official gold’, that held by central banks around the world, is
31,320 tonnes, or 1.01 billion troy ounces. In 2013 the total amount of money stock in the world was roughly $55 trillion.
If the world wanted 100% gold backing of all existing money, then the
implied price for an ounce of gold is ($55T/1.01BOz) = $54,455 per troy
ounce.
Clearly that’s a silly number (or is it?). But even a 10% partial
backing of money yields $5,400 per ounce. The point here is not to bandy
about outlandish numbers, but merely to point out that unless a great
deal of the world’s money stock is destroyed somehow, or a lot more
official gold is bought from the market and placed into official hands,
backing even a small fraction of the world’s money supply by gold will
result in a far higher number than today’s ~$1,080/oz.
The Difference Between Silver & Gold
A quick word on silver: often people ask me if I hold
“goldandsilver” as if it were one word. I do own both, but for almost
entirely different reasons.
Gold, to me, is a monetary substance. It has money-like qualities and
it has been used as money by diverse cultures throughout history. I
expect that to continue.
There is a slight chance that gold will be re-monetized on the
international stage due to a failure of the current all-fiat regime. If
or when the fiat regime fails, there will have to be some form of
replacement, and the only one that we know from the past that works for
sure is a gold standard. Therefore, a renewed gold standard has the best
chance of being the ‘new’ system selected during the next bout of
difficulties.
So gold is money.
Silver is an industrial metal with a host of enviable and
irreplaceable attributes. It is the most conductive element on the
periodic table, and therefore it is widely used in the electronics
industry. It is used to plate critical bearings in jet engines and as an
antimicrobial additive to everything from wall paints to clothing
fibers. In nearly all of these uses, plus a thousand others, it is used
in vanishingly-small quantities that are hardly worth recovering at the
end of the product life cycle — so they often aren’t.
Because of this dispersion effect, above-ground silver is actually
quite a bit less abundant than you might suspect. When silver was used
primarily for monetary and ornamentation purposes, the amount of
above-ground, refined silver grew with every passing year. After
industrial uses cropped up, that trend reversed. Today it’s calculated
that roughly half of all the silver ever mined in human history has been
irretrievably dispersed.
Because of this consumption dynamic, it’s entirely possible that over
the next twenty years not one single net new ounce of above-ground
silver will be added to inventories. In contrast, a few billion ounces
of gold are forecast to be added.
I hold gold as a monetary metal. I own silver because of its residual
monetary qualities, but more importantly because I believe it will
continue to be in demand for industrial uses for a very long time, and
it will become a scarce and rare item.
The Fed Indeed Cares About Gold
Gold, when unfettered, has a habit of sending signals that the Fed
very much doesn’t like. Therefore the Fed is at the top of everyone’s
suspect list when it comes to wondering who might be behind the
suspicious gold slams seen almost daily in today’s markets. Whether the
Fed does this directly is doubtful; but it has a lot of proxies out
there in its cartel network who likely are doing its dirty work.
To reveal the extent to which gold sits front and center in the Fed’s
mind, and how the Fed thinks of gold, here’s an excerpt from a 1993
FOMC meeting’s full transcript. Note that the full meeting notes from
Fed meetings are only released many years after the fact, long after
many or all of the voting members are no longer serving. (The most
recent ones available are only from 2009.) Listen to what this FOMC
voting member had to say about gold:
At the last meeting I was very concerned about what
commodity prices were doing. And as you know, they got lucky again and
told us that the rate of inflation was higher than we thought it was.
Now, I know there’s nothing to it but they did get lucky. I’ve had
plenty of econometric studies tell me how lucky commodity prices can
get. I told you at the time that the reason I had not been upset before
the March FOMC meeting was that the price of gold was well behaved.
But I said that the price of gold was moving. The price of gold at that time had moved up from 328 to 344,
and I don’t know what I was so excited about! I guess it was that I
thought the price of gold was going on up. Now, if the price of gold
goes up, long bond rates will not be involved.
People can talk about gold’s price being due to what the Chinese are buying; that’s the silliest nonsense that ever was. The
price of gold is largely determined by what people who do not have
trust in fiat money system want to use for an escape out of any
currency, and they want to gain security through owning gold.
A monetary policy step at this time is a win/win. I don’t know what
is going to happen for sure. I hope Mike is correct that the rate of
inflation will move back down to 2.6 percent for the remaining 8 months
of this calendar year. If we make a move and Mike is correct, we
could take credit for having accomplished this and the price of gold
will soon be down to the 328 level and we can lower the fed funds rate
at that point in time and declare victory.
(Source – Fed)
There it is, in black and white from an FOMC member’s own mouth spelling out the primary reason why I hold gold:
I lack faith in our fiat money system. He
nailed it. Or rather, I have very great faith that the people managing
the money system will print too much and ultimately destroy it. Same
thing, said differently.
And
of course the people at the Fed are acutely aware of
gold’s role as a barometer of people’s faith in ‘fiat money.’ Of course
they track it very carefully, discuss it, and worry about it when it is
sending ‘the wrong signals.’ I would, too, if in their shoes.
The Federal Reserve Note (a.k.a. the US dollar) is literally nothing
more than an idea. It has no intrinsic value. America’s money supply is
just digital ones and zeros careening about the planet, accompanied by a
much smaller amount of actual paper currency. The last thing an idea
needs is to be exposed as fraudulent. Trust is everything for a currency
— when that dies, the currency dies.
The other thing you can note from these FOMC minutes is that gold
pops up 19 times in the conversation. The Fed members are actively and
deliberately discussing its price, its role in setting interest rates,
and the psychological impact of a rising or falling gold price.
Later in that same meeting Mr. Greenspan says:
My inclination for today–and I’m frankly most curious to
get other people’s views–would be to go to a tilt toward tightness and
to watch the psychology as best we can. By the latter I mean to watch what is happening to the bond market, the exchange markets, and the price of gold…
I have one other issue I’d like to throw on the table. I hesitate to
do it, but let me tell you some of the issues that are involved here. If
we are dealing with psychology, then the thermometers one uses to
measure it have an effect. I was raising the question on the side with
Governor Mullins of what would happen if the Treasury sold a little gold
in this market.
There’s an interesting question here because if the gold
price broke in that context, the thermometer would not be just a
measuring tool. It would basically affect the underlying psychology.
Now, we don’t have the legal right to sell gold but I’m just frankly
curious about what people’s views are on situations of this nature
because something unusual is involved in policy here. We’re not
just going through the standard policy where the money supply is
expanding, the economy is expanding, and the Fed tightens. This is a
wholly different thing.
The recap of all this is that the Fed watches the price of gold
carefully, frets over whether the price of gold is ‘sending the right
signals’ to market participants, and pays attention to gold’s impact on
market psychology (with an eye to controlling it).
In short, the Fed keeps a close eye on the “golden thermometer”.
Back to the supply story for gold. Not long after gold began its
downward price movement in 2012, the GLD ETF trust began coughing up a
lot of gold, eventually shedding more than 500 tonnes; a truly massive
amount.
In my mind, the absolute slamming of gold in 2013 was done by a few
select entities and represents one of the clearest cases of price
manipulation on the recent record. While we can debate the reasons ‘why’
gold was manipulated lower or ‘who’ did it, to me, there’s no question
about
how it was done. Or
that it was done.
Massive amounts of paper gold were dumped into a thin overnight
market with the specific intent of driving down the price of gold.
It’s an open and shut case of price manipulation. Textbook perfect.
Even if these bear raids were performed by self-interested parties
that made money while doing it, you can be sure the Fed was smiling
thankfully in the background and that the SEC wasn’t going to spend one
minute looking into whether any securities laws were broken (especially
those related to price manipulation).
Gold’s falling “thermometer” was exactly what the central planners wanted the world to see.
Down And Out
The paper markets for gold are centered in the US, while the physical
market for gold is centered in London (and increasingly Shanghai). It’s
safe to say that the paper markets set the spot price, while the
physical movement of gold originates in London.
What’s increasingly obvious is the growing disconnect between the
paper and physical markets. This is exactly what we’d expect to see if
the paper markets were pushing in one direction (down) while physical
gold was heading in a different direction (out).
The tension between these ‘down and out’ movements is building and,
according to a senior manager of one of the largest gold refineries in the world located in Switzerland, the current price of gold “has no correlation to the physical market.”
He notes a lot of on-going tightness in the physical market.
Unsurprisingly, gold is moving from West to East with vaults in London
supplying much of the physical metal that’s being refined into fresh
kilo bars and sent off to China and India.
But given the astonishing amount of physical demand, why has the
price of gold been heading steadily lower over the past several years?
The aforementioned Swiss refiner is equally perplexed:
If I am honest, the only thing I could share now with you
would be that I’m perplexed about the discrepancy between the prices
and the situation of the physical market. This is something I still do
not understand and is a riddle for me every day. For all people who are
interested in precious metals, the physical side of this business should
be given more emphasis.
(Source – Transcript)
There’s no mystery as to demand going up in China and India as the
price of gold has moved down. Interested buyers will buy more at a lower
price.
But it’s a big mystery as to why Western “investors” seem more interested in selling gold than buying it right now.
Go East Young Man
The biggest untold story of the past few years has been the
absolutely massive extent of the flow of gold heading from the West to
the East. Gold has been leaving London and Switzerland and heading to
China and India.
Besides the first-hand experience of the Swiss refiner, there have
been numerous stories in the main stream press also pointing to
tightness in the London physical gold market as well as relentless
demand from China and India being the driver of that condition:
Gold demand from China and India picks up
Sep 2, 2015
London’s gold market is showing tentative signs of increased demand
for bullion from consumers in emerging markets, after the price of the
precious metal fell to its lowest level in five years in July.
The cost of borrowing physical gold in London has risen sharply in recent weeks. That
has been driven by dealers needing gold to deliver to refineries in
Switzerland before it is melted down and sent to places such as India, according to market participants
“[The rise] does indicate there is physical tightness in the market for gold for immediate delivery,” said Jon Butler, analyst at Mitsubishi.
The move comes as Indian gold demand picked up in July, with shipments of gold from Switzerland to India more than trebling.
Most of that gold is likely to originally come from London before it is
melted down into kilobars by Swiss refineries, according to analysts.
In the first half of this year, total recorded exports of gold from the UK were 50 per cent higher than the first half of 2014,
on a monthly average basis, according to Rhona O’Connell, head of
metals for GFMS at Thomson Reuters. More than 90 per cent was headed for
a combination of China, Hong Kong and Switzerland.
London remains the world’s biggest centre for trading and storing gold.
(Source)

Shipments and exports are up very strongly and nearly all of that gold is headed to just two countries; China and India.
India Precious Metals Import Explosive – August Gold 126t, Silver 1,400t
Sept 10, 2015
In the month of August 2015, India imported 126 tonnes of gold and 1,400 tonnes of silver, according to data from Infodrive India. Gold import into India is rising after a steep fall due to government import restrictions implemented in 2013.
Year-to-date India has imported 654 tonnes of gold, which is
66 % up year on year. 6,782 tonnes in silver bars have crossed the
Indian border so far this year, up 96 % y/y.
Gold import is set to reach an annualized 980 tonnes, which would be
up 26 % relative to 2014 and would be the second highest figure on (my)
record – my record goes back to 2008.
Silver import is on track to reach an annualized 10,172 tonnes, up 44 % y/y! This would be a staggering 37 % of world mining.
(Source)
To summarize, the gold and silver imports into India have been
absolutely on a tear lately as that country tends to buy more and more
as the price drops lower and lower.
While the paper games setting the price of gold and silver in the
West continue to support lower and lower prices, for whatever reasons,
this only stimulates more demand from China and India.
Seen collectively, there’s what gold demand looks like for “Chindia.”
(
Source)
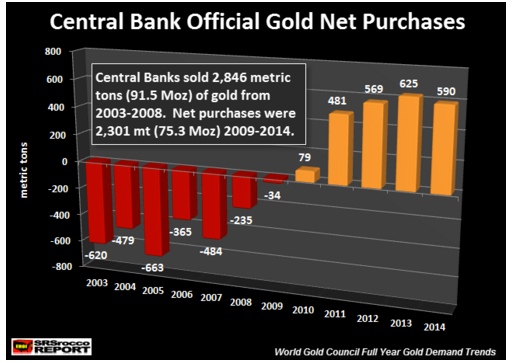
To make things even more interesting, the world’s central banks have
been increasingly strong net buyers, not sellers, of gold for the past 5
years.
Central Banks
Another factor driving demand has been the reemergence of central
banks as net acquirers of gold. This is actually a pretty big deal. Over
the past few decades, central banks have been actively reducing their
gold holdings, preferring paper assets over the ‘barbarous relic.’
Famously, Canada and Switzerland vastly reduced their official gold
holdings during this period (to effectively zero in the case of Canada),
a decision that many citizens of those countries have openly and
actively questioned.
The UK-based World Gold Council is the primary firm that aggregates
and reports on gold supply-and-demand statistics. Here’s their most
recent data on official (i.e., central bank) gold holdings:
After more than a decade of selling gold to suppress the price,
central banks turned into net acquirers right as gold began its plummet
from its 2011 highs. 2015 looks to be
an even stronger year for central bank purchases.
With China and India’s combined appetite for gold being higher than
total world mining output, and central banks on a buying spree, it only
stands to reason that somebody has to be parting with their physical
gold — and those selling entities appear to be substantially located in
the US and UK.
An interesting piece of detective work
was done by Ronan Manly at Bullionstar.com where
he noted that the LBMA reported pronounced drops in the amount of gold
stored in London vaults, which includes both gold held at the Bank of
England as well as non-official vaults within the LBMA system.
To summarize his report, here’s the amount of gold reportedly held in London:
- April 2014 – 9,000 tonnes
- Early 2015 – 7,500 tonnes
- June 2015 – 6,250 tonnes
That means that 2,750 tonnes left London over the past 1+ year.
Does such a large number even make sense?
Well, sure, if we consider that just these four countries
cumulatively imported (or increased reserves) by ~4,500 tonnes since the
beginning of 2014.
Confirming this is this handy chart of UK gold flows as compared to Shanghai Gold Exchange (SGE) withdrawals:
Quite interestingly, the highest flows out of the UK were during the
months of the gold price bloodbath in early 2013 (a coincidence?), but
the flows had picked up in earnest in the months prior. Without the
‘liberation’ of gold from GLD, it’s quite possible that physical
shortages would have appeared much earlier. Again, the price smash of
gold seems to have been a stroke of good luck for the central planners
in the West, both for the psychological impact but also for liberating
so much physical gold from weak hands.
What we can also see is that, generally speaking, the UK has been
steadily losing gold month in and month out for the past 2.5 years. Also
interestingly, the gold that the UK does import has mainly come, of
late, from the US and Canada.
The only question is:
How much longer can this continue?
Ronan Manly took a stab at estimating how much of the remaining 6,250
tonnes of gold in the UK was available for export and the answer was
‘not very much.’ He estimated that, of the gold that did not belong to
the BoE, that perhaps ~120 tonnes was not spoken for by various gold
ETFs and other allocated accounts. To put that in context, 120 tonnes is
a couple of weeks of demand at China’s Shanghai Exchange, or a month of
Indian demand.
Warning Signs At The COMEX
While I used to be among the people that expected the eventual
default on gold to happen in the COMEX warehouse, I no longer think
that. In fact, should things ever get to the point that COMEX cannot
deliver on a physical contract, the rules will almost certainly be
changed to force a cash settlement and that will be that.
When things get serious, they lie. Or change the rules. Or both.
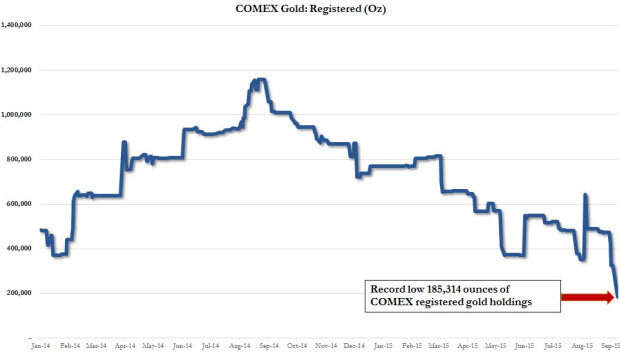
However, the internet has been abuzz lately with some very
interesting oddities coming out of the COMEX, notably a sharp decline in
the amount of gold that is ‘registered’ to be delivered to settle a
futures contract that has matured and declared for physical delivery.
(
Source)
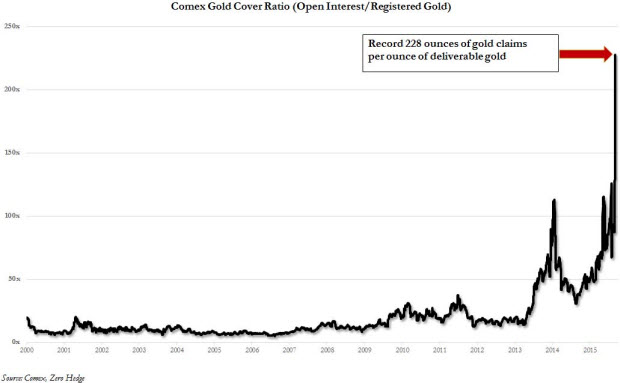
When compared to the number of contracts outstanding, the ratio of open contracts to registered gold has never been higher.
This means that, if just 0.5% of the futures contracts stood for
delivery, the COMEX warehouse would be wiped out of registered gold.
The reason this is not actually a big concern is that new gold can
and would be moved out of the ‘eligible’ category and over to the
registered category to satisfy whatever shortfall existed.
For those interested, here’s a quick primer on the distinction between ‘eligible’ and ‘registered’:
Eligible Silver
To be eligible for storage in a CME-authorized depository, silver
must be 99.9 percent pure. For the standard 5,000-ounce futures
contract, the silver must be cast into bars weighing 1,000 troy ounces,
give or take 6 percent. Each silver bar must be marked with its weight,
purity, a serial number and the brand of the refiner. Only brands
officially listed by the CME can be eligible for storage. Should a
refiner deliver silver that is below standard, the metal is rejected or
sold, and the refiner risks losing its authorization to warehouse silver
for Comex futures.
Registered Silver
Eligible silver stored at a CME-authorized depository is not
available for sale unless it is registered. An owner can register
eligible silver deposits by having the depository issue a warrant that
certifies the details of ownership. Silver warrants were once printed on
paper, but were converted to electronic form in 2011. Not all eligible
silver is registered for sale, but all registered silver must first be
eligible. Silver owners frequently extend or withdraw registration
depending on whether or not they wish to sell their holdings at current
prices.
(Source)
The real question is whether there’s enough total gold at the COMEX
to cover any physical buying demand that might arise and the answer, for
now, is ‘yes’:
The reason I don’t worry about (or hope for) a COMEX default is that
it’s not really a place where players show up to get physical gold (or
silver). It’s merely a depository that provides the necessary optics for
paper speculators to place bets against each other.
Yes, it’s the place that ends up setting the price of gold and silver
for the world, but the number of shenanigans that can be pulled to
manipulate prices higher or lower are numerous and routinely used.
When I Would Worry About (or Hope For) A Default
My view is that the first stage of a sharp rebound in the price of
gold will begin with increasing tightness and eventually shortages in
the London bullion market.
Needing to secure more gold, on a reasonable time frame, refiners
would then turn to the COMEX market, but with the intention of taking
delivery. If/when that happens it won’t take long for COMEX to be
stripped clean of both categories of gold.
There’s ~220 tonnes of gold in COMEX and, again, that’s just a month
or two of current demand (that is in excess of total world mining
output).
As soon as it’s recognized that COMEX is being drawn upon to satisfy
Eastern demand, the price fireworks will start. Or the rules will be
changed. But I’m betting on price being the chosen mechanism to align
supply and demand.
The summary of the fundamental analysis of gold demand is
- there is a huge and pronounced flow of gold from the West to the East
- there is rising demand from all quarters except for the ‘hot money’ GLD investment vehicle (which I have never been a fan of)
- all of this demand has handily outstripped mine supply which means
that someone’s vaults are being emptied (the West’s) as someone else’s
are rapidly filling (the East’s)
Now about that supply…
Gold Supply
Not surprisingly, the high prices for gold and silver in 2010 and
2011 stimulated a lot of exploration and new mine production.
Conversely, the bear market from 2012 though 2015 has done the opposite.
However, the odd part of the story for those with a pure economic
view is that, with more than a decade of steadily rising prices, there
has been relatively little incremental new mine production. But for
those of us with an understanding of resource depletion, it’s not
surprising at all.
In 2011, the analytical firm Standard Chartered calculated a
subdued 3.6% rate of gold production growth over the next five years
based on lowered ore grades and very high cash operating costs:
Most market commentary on gold centers on the direction
of US dollar movements or inflation/deflation issues – we go beyond this
to examine future mine supply, which we regard as an equally important
driver. In our study of 375 global gold mines and projects, we note
that after 10 years of a bull market, the gold mining industry has done
little to bring on new supply. Our base-case scenario puts gold
production growth at only 3.6% CAGR over the next five years.
(Source – Standard Chartered)
Since then, the trends for lower ore grade and higher costs have only
gotten worse. But the huge drop in the price of gold in 2011 and 2012
was the final nail in the coffin and resulted in the slashing of CAPEX
investment by gold mining companies.
Of course, none of this is actually surprising to anyone who
understands where we are in the depletion cycle, but it’s probably quite
a shock to many an economist. The quoted report goes on to calculate
that existing projects just coming on-line need an average gold price of
$1,400 to justify the capital costs, while green field, or brand-new,
projects require a gold price of $2,000 an ounce.
This enormous increase in required gold prices to justify the
investment is precisely the same dynamic that we are seeing with every
other depleting resource: energy costs run smack-dab into declining ore
yields to produce an exponential increase in operating costs. And it’s
not as simple as the fuel that goes into the Caterpillar D-9s; it’s the
embodied energy in the steel and all the other energy-intensive mining
components all along the entire supply chain.
Just as is the case with oil shales that always seem to need an oil
price $10 higher than the current price to break even, the law of
receding horizons (where rising input costs constantly place a resource
just out of economic reach) will prevent many an interesting, but
dilute, gold ore body from being developed. Given declining net energy,
that’s that same as “forever” as far as I’m concerned.
Just like any resource, before you can produce it you have to find
it. Therefore the relationship between gold discoveries and future
output is a simple one; the more you have discovered in the past, the
more you can expect to produce in the future, all things being equal.
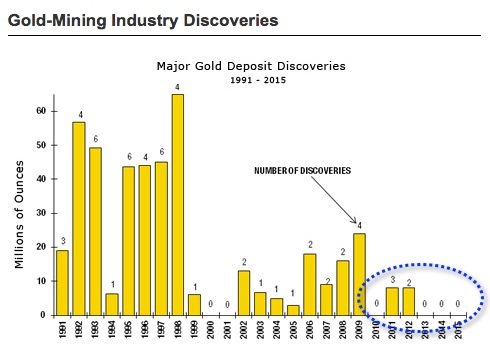
This next chart should tell you everything you need to know about
where we are in the depletion cycle for gold, as even with the steadily
rising prices between 1999 and 2011 (going from $300 an ounce to
$1,900), gold discoveries plummeted in 1999 and remained on the floor
thereafter:
Here we see that the 1990’s decade saw quite a number of large
discoveries that are currently still in production but which were not
matched in later years. Since it takes roughly ten years to bring a mine
into full production following discovery, it’s fair to say that we are
currently enjoying production from the discoveries of the 1990’s. Future
gold production will largely be shaped by the discoveries made since
then.
In other words:
Expect less gold production in the future.
Meanwhile, there will be more money, more credit, and more people
(especially in the East) competing for that diminished supply of gold
going forward.
Let’s take another angle on gold supply, one which circles back and
supports the above chart showing fewer and smaller discoveries in recent
years.
The United States Geological Survey, or USGS, keeps a mountain of
data on literally every important mined substance. I think it’s staffed
by credible people, doing good work, and I’ve yet to detect overt
political influence in their reported statistics.
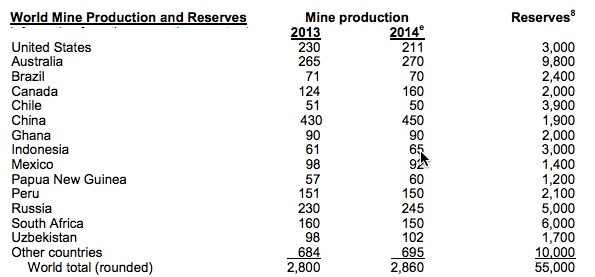
At any rate, the latest assessment on gold reveals that their best
guess for world supply is that something on the order of 52,000 tonnes
of reserves are left. Which means that, at the 2012 mining rate of 2,700
tonnes, there are 19 years of reserves left:
This doesn’t mean that in 19 years there will be no more new gold to
be had, as reserves are always a function of price; but it gives us a
sense of what’s out there right now at current prices.
As much as I like the folks at the USGS, I will point out one glaring
discrepancy in their data as a means of exposing why I think these
reserves, like those for many other critical things like oil, are
probably overstated. And that story begins with South Africa.
There you’ll note that, at 6,000 tonnes, South Africa has the second
largest stated country reserves. However, according to official South
African data, they claim to have an astonishing 36,000 tonnes of
reserves. Which is right?
Neither as it turns out.
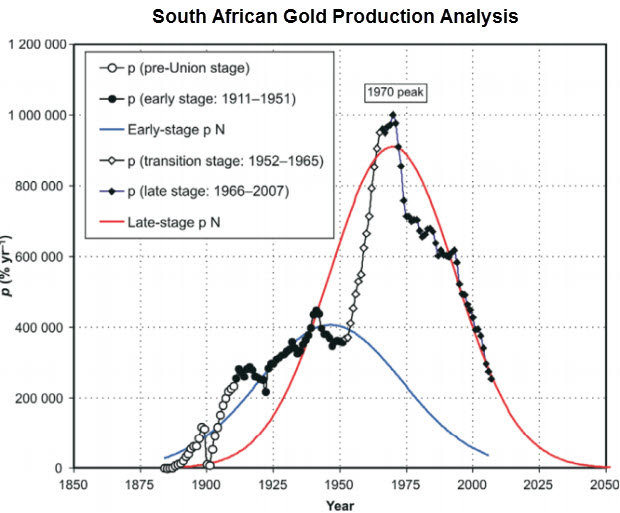
First, the true story of South African gold production is completely
obvious from the production data. It’s a story of being well and truly
past the peak of production:
And not just a little bit past peak, but 44 years past; down a bit
more than 80% from the peak in 1970. The above chart is simply not
even slightly in alignment with the claims of the South African
government to have 36,000 tonnes of reserves. But pity the poor South
African government, which knows that gold exports represent fully one
third of all their exports. Of course they will want to loudly proclaim
massive reserves that will support many future years of robust exports.
Instead, the South African production data can be modeled by the same methods as any other depleting resource and
one such analysis has been done and arrived at the conclusion that there are around 2,900 tonnes left to be mined in South Africa.
The analysis is quite sound; and the authors went on to point out
that the social, economic, energy, and environmental costs of extracting
those last 2,900 tonnes are quite probably higher than the current
market value of those same tonnes. If they are extracted, South Africa
will be net poorer for those efforts. This is the same losing
proposition as if it took more than one barrel of oil to get a barrel of
oil out of the ground — the activity is a loss and should not be
undertaken.
For lots of political and economic reasons, however, gold mining will
continue in South Africa. But, realistically… someone in government
there should be thinking this through quite carefully.
The larger story wrapped into the South African example is this:
Perhaps there are 19 years of global gold reserves left (at current rates of production), but I doubt it.
Instead, the story of future gold production will be one of declining
production at ever higher extraction costs — exacerbated by the
80,000,000 new people who swell the planet’s population every twelve
months, the hundreds of millions of people in the East who enter the
ranks of the middle class annually, and the trillions of new monetary
claims that are forced into the system each year.
And this brings me to my final point of the public part of this report.
Scarcity
If we cast our minds forward ten years and think about a world with
oil costing 2x to maybe 4x more than today, we have to ask ourselves
some important questions:
- How many of our currently-operating gold and silver mines, or the
base metal mines from which gold and silver are by-products, will still
be in operation then?
- How many will simply shut down because their energy and associated costs will have exceeded their marginal economic benefits?
After just 100 years of modern, machine-powered mining, all of the
great ore bodies are gone, most of the good ones are already in
operation, and only the poorest ones are left to be exploited in the
future.
By the time you are reading stories like this next one, you should be
thinking, man, we’re pretty far along in the story of depletion, aren’t
we?
South African Miners Dig Deeper to Extend Gold Veins’ Life Spans
Feb, 2011
JOHANNESBURG—With few new gold strikes around the world that can be
turned into profitable mines, South Africa’s gold miners are planning to
dig deeper than ever before to get access to rich veins.
Mark Cutifani, chief executive officer of AngloGold Ashanti Ltd., has
a picture in his office of himself at one of the deepest points in
Africa, roughly 4,000 meters, or 13,200 feet, down in the company’s
Mponeng mine south of Johannesburg. Mr. Cutifani sees no reason why
Mponeng, already the deepest mining complex in the world, shouldn’t in
time operate an additional 3,000-plus feet deeper. Deep mining isn’t
easy, nor pleasant. The deeper a mine goes, the more at risk it is from
underground earthquakes, rock bursts, gas discharges and flooding. And
for workers, conditions themselves get progressively more uncomfortable
from heat and cramped spaces.
South Africa is at the forefront of deep mining. Agnico-Eagle
Mines Ltd.’s LaRonde mine in northwestern Quebec, one of the deepest
mines outside South Africa, operates at about 7,260 feet below the
surface. Before closing in 2002, Homestake Gold Mine in South Dakota was
considered the deepest mine in the Western Hemisphere at about 8,045
feet.
(Source)
The above article is just a different version of the story that led
to the Deepwater Horizon incident. Greater risks and engineering
challenges are being met by hardworking people going to ever greater
lengths to overcome the lack of high quality reserves to go after.
By the time efforts this exceptional are being expended to scrape a
little deeper, after ever smaller and more dilute deposits, it tells the
alert observer everything they need to know about where we are in the
depletion cycle, which is, we are closer to the end than the beginning.
Perhaps there are a few decades left, but we’re not far off from the
day where it will take far more energy to get new metals out of the
ground compared to scavenging those already above ground in refined
form.
At that point we won’t be getting any more of them out of the ground,
and we’ll have to figure out how to divvy up the ones we have on the
surface. This is such a new concept for humanity — the idea of actual
physical limits — that only very few have incorporated this thinking
into their actions. Most still trade and invest as is the future will
always be larger and more plentiful, but the data no longer supports
that view.
We are at a point in history where we can easily look forward and
make the case for declining per-capita production of numerous important
elements just on the basis of constantly falling ore grades. Gold and
silver fit into that category rather handily. Depletion of reserves is a
very real dynamic. It is not one that future generations will have to
worry about; it is one with which people alive today will have to come
to terms.
Protecting Your Wealth With Gold
For all the reasons above, it’s only prudent to consider gold an essential element of a sound investment portfolio.
In
Part 2: Using Gold to Protect Yourself In Advance of the Greatest Wealth Transfer of Our Lifetime we
detail out the specifics of how much of your net worth to consider
investing in gold, in what forms to hold it, which price targets are
gold and silver most likely to reach, and which eventual indicators to
look for that will signal that it’s time to sell out of your precious
metal investments.
The battle to keep gold’s price in check is truly one for the ages.
Not because gold deserves such treatment, but because the alternative is
for the world’s central planners to admit that they’ve poorly managed
an ill-designed monetary system of their own creation.
Make sure you’re taking steps today to ensure that the purchasing
power of your wealth is protected, if not enhanced, when the trends
identified above arrive in full force.
Click here to read Part 2 of this report
(free executive summary, enrollment required for full access)


 FactSet
 Ryan Detrick

 Daily News