The Dot-Com darling Uber has been getting quite a bit
of critical press lately, and deservedly so. Uber is a start-up company
that connects private citizens together for personal transportation:
instead of hiring a licensed, bonded taxi service, an Uber user signals
that they wants a ride via a smartphone app, and another Uber user who
feels like offering rides (for money) accepts the summons and couriers
the person wanting a ride wherever they want to go. Uber, as the
facilitator, takes a cut of the money that the rider pays the driver.
The service model seems to work well, and the company is making a
profit. What isn’t working for Uber is the recent appalling behaviour of their executives. As National Public Radio’s Geoff Nunberg explained it on 10th December:
‘Uber uses a map view that shows the locations of all the Uber
cars in an area and silhouettes of the people who ordered them. The
media seized on the term this fall when it came out[1]
that the company had been entertaining itself and its guests by pairing
that view with its customer data so it could display the movements of
journalists and VIP customers as they made their way around New York.
‘Those reports came on top of earlier criticisms of Uber for
taking a prurient interest in its customers’ movements. Not long before,
an Uber data scientist had blogged about tracking what he called “rides of glory.”
Those were the customers who booked rides late on weekend nights and
then returned home a few hours later, presumably after one-night stands …
‘Those were awkward revelations for Uber, which has also been under fire
for its sharp-elbowed tactics with regulators and competitors and a
truculent attitude toward its critics. The so-called sharing economy
depends on users providing a company with enough personal information to
reassure others that it’s OK to rent to or drive around with. …So it
doesn’t look good when the people entrusted with the information come
off as a crew of cocky striplings who seem to take privacy and security casually.’
Read more
Tuesday, December 23, 2014
Don't Tell Germany Draghi Is About To Monetize 90% Of Bund Issuance
The next time anyone is stupid enough to mention monetary policy "normalization", either have them read this:
... And this:
Or just show them this chart.

And since Japan no longer cares what the lunatics in charge do as its fate is sealed anyway, please make sure any Germans observing the above are unable to see the chart below, which shows what happened the last time a central bank monetized all of their Bund issuance.

The Germans are going to need a bigger chart.
Translated: the BOJ will monetize 100% of all Japanese debt issuance (source).The Bank of Japan’s expansion of record stimulus today may see it buy every new bond the government issues.
The BOJ said it plans to buy 8 trillion to 12 trillion yen ($108 billion) of Japanese government bonds per month under stepped-up stimulus it announced today. That gives Governor Haruhiko Kuroda leeway to soak up the 10 trillion yen in new bonds that the Ministry of Finance sells in the market each month.
... And this:
Translated: the ECB will monetize 90% of all German debt issuance (source).in Q1, we expect the ECB to announce a EUR500bn sovereign QE program and buy EMU government bonds according to each EMU country’s ECB capital key contribution. This implies that the ECB would purchase EUR130bn of German bonds, i.e., 90% of the 2015 gross issuance of German Bunds.
Or just show them this chart.

And since Japan no longer cares what the lunatics in charge do as its fate is sealed anyway, please make sure any Germans observing the above are unable to see the chart below, which shows what happened the last time a central bank monetized all of their Bund issuance.

The Germans are going to need a bigger chart.
WALL STREET HEDGE FUNDS FLEE HOUSING MARKET
by James Quinn
 Submitted by Tyler Durden on 12/22/2014 10:08 -0500
Yes, the housing recovery storyline keeps being
pushed back month after month. Existing home sales plunged by 6.1% in
one month. Existing home sales are 8% LOWER than they were in July of
2013. Does that happen in a recovery? Sales of existing homes were up 2%
over last year, but the distribution of sales tells the real story.
Homes selling for less than $100k crashed by 16%. Homes selling between
$100k and $250k fell by 1%. These two categories account for 61% of all
home sales.
The NAR touts the fact that home prices were 5%
higher than last year. What they did not tell you is that home prices
have fallen for the 5th month in a row and are now 7.5% LOWER than they
were in June. Is that a sign of a housing recovery?
Good old Larry Yun, the latest NAR shill who
will write a book after he leaves about how it was his job to lie,
assures us this is just a one month aberration caused by the stock
market going down for a few days in October. Everyone knows that you
make a home purchase decision based upon the day to day fluctuations in
the stock market. So this douchebag blames the plunge in home sales on
the stock market. Let’s test his hypothesis.
Dow on Oct 1 – 16,801
Dow on Oct 31 – 17,390
Dow on Dec 1 – 17,776
So the Dow was up about 1,000 points in October
and November and this pitiful excuse for a human being blames the
housing plunge on the stock market?
Here is the facts jack. Blackrock and the rest
of the Wall shysters see the writing on the wall. Their master plan to
drive prices higher with free money from the Fed worked to perfection.
The investors and flippers are exiting stage left. At one point cash
sales reached 36% of all transactions. It has plunged to 25% of all
transactions as Wall Street sells before the flippers and average people
left holding the bag. It’s no coincidence prices are falling. The fake
housing recovery is over. Sales and prices will continue to fall.
Real people have lower real wages than they did
at the depths of the recess ion in 2009. Fannie and Freddie are
attempting to use your tax dollars to create another subprime mortgage
bubble, but it’s too late. The recession is under way and housing is
headed back into the toilet. I wonder what Larry Yun will do when he
resigns from the NAR in disgrace like David Lereah?
Existing Home Sales Collapse Most Since July 2010, Downtick In Stock Market Blamed
Having exuberantly reached its highest level since September 2013
last month (despite the total collapse in mortgage applications), it
appears the ugly reality of the housing market has peeked its head out
once again.As prices rose, existing home sales plunged 6.1% –
the most since July 2010 (against an expected 1.1% drop) to 4.93mm SAAR
(the lowest in 6 months).


So what was it this time: the polar vortex, the crude collapse, the crude vortex? Neither: According to the NAR’s endlessly amusing Larry Yun, this time it was the stock market:
In other words, according to the NAR, even the tiniest downtick in stocks, and the housing market gets it.
Sure enough, it is time to boost confidence in a rigged, manipulated ponzi scheme:
Meanwhile, it appears investors have left the building…

Every part of America saw a collapse:
But the punchline: the median price of existing homes dropped to $205,300…

… because, well, there is a “lack of supply.”
yep – that must be it…

http://www.zerohedge.com/news/2014-12-22/existing-home-sales-collapse-most-july-2010-miss-most-3-years

So what was it this time: the polar vortex, the crude collapse, the crude vortex? Neither: According to the NAR’s endlessly amusing Larry Yun, this time it was the stock market:
“The stock market swings in October may have impacted some consumers’ psyche and therefore led to fewer November closings. Furthermore, rising home values are causing more investors to retreat from the market.”Supposedly he is referring to the tumble, not the resulting Bullard “QE4? mega-explosion in stocks that pushed everyhting to new all time highs.
In other words, according to the NAR, even the tiniest downtick in stocks, and the housing market gets it.
Sure enough, it is time to boost confidence in a rigged, manipulated ponzi scheme:
- DROP IN NOVEMBER COULD BE ONE-MONTH ‘ABERRATION,” YUN SAYS
Meanwhile, it appears investors have left the building…

Every part of America saw a collapse:
November existing-home sales in the Northeast declined 4.2 percent to an annual rate of 680,000, but are still 4.6 percent above a year ago. The median price in the Northeast was $246,100, which is 1.3 percent above a year ago.Some more amusing details from the report:
In the Midwest, existing-home sales fell 8.9 percent to an annual level of 1.13 million in November, and are now 1.7 percent below November 2013. The median price in the Midwest was $160,500, up 7.0 percent from a year ago.
Existing-home sales in the South decreased 3.2 percent to an annual rate of 2.09 million in November, but remain 5.0 percent above November 2013. The median price in the South was $176,500, up 5.2 percent from a year ago.
Existing-home sales in the West dropped 9.6 percent to an annual rate of 1.03 million in November, and remain 1.0 percent below a year ago. The median price in the West was $292,700, which is 3.5 percent above November 2013.
The median existing-home price2 for all housing types in November was $205,300, which is 5.0 percent above November 2013. This marks the 33rd consecutive month of year-over-year price gains.But don’t worry about all that: the NAR couldn’t be happier that just like in the last housing bubble, so too now Fannie and Freddie’s new 3% down payment initiative, means the bubble is about to get bigger than ever:
Total housing inventory3 at the end of November fell 6.7 percent to 2.09 million existing homes available for sale, which represents a 5.1-month supply at the current sales pace – unchanged from last month. Despite the tightening in supply, unsold inventory remains 2.0 percent higher than a year ago, when there were 2.05 million existing homes available for sale.
“Lagging homebuilding activity continues to hamstring overall housing supply and is still too low in relation to this year’s promising job growth,” says Yun. “Much faster price and rent appreciation – easily exceeding wage growth – will occur next year unless new construction picks up measurably.”
All-cash sales were 25 percent of transactions in November, down from 27 percent in October and 32 percent in November of last year.
Individual investors, who account for many cash sales, purchased 15 percent of homes in November, unchanged from last month and below November 2013 (19 percent). Sixty-one percent of investors paid cash in November.
The percent share of first-time buyers in November climbed to 31 percent, up from October (29 percent) and is the highest share since October 2012 (also 31 percent). First-time buyers have represented an average of 29 percent of buyers through November of this year.
Distressed sales – foreclosures and short sales – were unchanged in November from October (9 percent) and remained in the single digits for the fourth month this year; they were 14 percent a year ago. Six percent of November sales were foreclosures and 3 percent were short sales. Foreclosures sold for an average discount of 17 percent below market value in November (15 percent in October), while short sales were discounted 13 percent (10 percent in October).
Properties typically stayed on the market in November longer (65 days) than last month (63 days) and a year ago (56 days). Short sales were on the market the longest at a median of 116 days in November, while foreclosures sold in 65 days and non-distressed homes took 63 days. Thirty-two percent of homes sold in November were on the market for less than a month.
NAR President Chris Polychron, executive broker with 1st Choice Realty in Hot Springs, Ark., says Fannie Mae and Freddie Mac’s new low downpayment program should improve access to credit for responsible buyers. “NAR applauds Fannie and Freddie’s commitment to homeownership by serving creditworthy borrowers who lack the resources for substantial downpayments plus closing costs with its new downpayment program,” he said. “The new program mitigates risk with strong underwriting and ensures that responsible buyers have access to safe and affordable mortgage credit. Furthermore, NAR believes lenders must do their part to ensure loans are prudently underwritten and are made available to qualified borrowers.”And since the taxpayers will be left to bail out the excesses of this latest incipient housing bubble, what’s not to like?
But the punchline: the median price of existing homes dropped to $205,300…

… because, well, there is a “lack of supply.”
Nov existing home sales fell 6.1% to 4.93M-the lowest level since last May (4.91M). Lack of supply continues to weigh on the #housing market

http://www.zerohedge.com/news/2014-12-22/existing-home-sales-collapse-most-july-2010-miss-most-3-years
Uncle Sam Does The Impossible: Loses $105 Million/Year Coining Money!
Submitted by NCPA via Contra Corner blog,
It costs the United States nearly twice as much to make a penny as that penny is actually worth, writes Christopher Ingraham for the Washington Post, reporting that it costs the government 1.7 cents to make a penny.

And pennies aren’t the only problem: it costs the government more than 8 cents to make a nickel.
A new report from the U.S. Mint reveals that it’s still not cost-effective to make pennies and nickels. Pennies and nickels used to be profitable in the early 2000s, says Ingraham, but the cost of producing the coins began rising in 2006 and has only gone up. While currency costs fell overall this year due to declining copper prices, the two coins still cost more than their face value. The rest of American currency is doing alright:
While, alternatively, the United States could save money by changing coins’ metal makeup, such a move would require vending machines to be upgraded across the country, costing billions.
* * *
As a reminder, here is Kyle Bass' famous 'nickel' trade from 2011 (that is working even better now)...
On nickels:
Anyone want to buy a wheelbarrow?
It costs the United States nearly twice as much to make a penny as that penny is actually worth, writes Christopher Ingraham for the Washington Post, reporting that it costs the government 1.7 cents to make a penny.
And pennies aren’t the only problem: it costs the government more than 8 cents to make a nickel.
A new report from the U.S. Mint reveals that it’s still not cost-effective to make pennies and nickels. Pennies and nickels used to be profitable in the early 2000s, says Ingraham, but the cost of producing the coins began rising in 2006 and has only gone up. While currency costs fell overall this year due to declining copper prices, the two coins still cost more than their face value. The rest of American currency is doing alright:
- It costs 5.4 cents to make a dollar bill.
- It costs 8.95 cents to make a quarter.
- It costs 3.91 cents to make a dime.
While, alternatively, the United States could save money by changing coins’ metal makeup, such a move would require vending machines to be upgraded across the country, costing billions.
* * *
As a reminder, here is Kyle Bass' famous 'nickel' trade from 2011 (that is working even better now)...
On nickels:
He still owned stacks of gold and platinum bars that had roughly doubled in value, but he remained on the lookout for hard stores of wealth as a hedge against what he assumed was the coming debasement of fiat currency. Nickels, for instance.
“The value of the metal in a nickel is worth six point eight cents,” he said. “Did you know that?”
I didn’t.
“I just bought a million dollars’ worth of them,” he said, and then, perhaps sensing I couldn’t do the math: “twenty million nickels.”
“You bought twenty million nickels?”
“Uh-huh.”
“How do you buy twenty million nickels?”
“Actually, it’s very difficult,” he said, and then explained that he had to call his bank and talk them into ordering him twenty million nickels. The bank had finally done it, but the Federal Reserve had its own questions. “The Fed apparently called my guy at the bank,” he says. “They asked him, ‘Why do you want all these nickels?’ So he called me and asked, ‘Why do you want all these nickels?’ And I said, ‘I just like nickels.’”
He pulled out a photograph of his nickels and handed it to me. There they were, piled up on giant wooden pallets in a Brink’s vault in downtown Dallas.
“I’m telling you, in the next two years they’ll change the content of the nickel,” he said. “You really ought to call your bank and buy some now.”
Anyone want to buy a wheelbarrow?
Grow Your Way Out Of Debt? Don't Make Us Laugh...!
Submitted by Bill Bonner via Acting-Man blog,
The idea is to measure total spending. And in this way, also measure production. Most things produced are sold. Add up how much spending there is and you get an idea of how much production there’s been.
US GDP is reported to be $18 trillion a year – with $3.5 trillion coming from US federal government spending. Add state and local government spending, and the total rises to more than $6 trillion.
This means that the private sector – the part that pays the bills – is only $12 trillion. Total debt – government, corporate and personal – in the US is now $58 trillion (misreported yesterday as $59 trillion… but what’s a trillion dollars between friends?). That’s nearly five times the real economy that supports it.
And it helps explain why it is so hard to “grow your way out” of debt. Assuming an annual interest rate of 2%, even if you could contain debt increases to 3% of GDP a year, the productive part of the economy would have to grow at 5% just to stay even. No developed economy in the world is growing that fast.
At an interest rate of 3%, the annual interest on $58 trillion is $1.7 trillion. That’s slightly less than 10% of GDP. But it’s 14% – or one of every seven dollars – of the private sector economy.
And as recently as January 2002, the 10-year Treasury note yielded over 5%. If the average interest rate were to rise to that level again – and sooner or later it will – it would take $3 trillion to service America’s debt – or one-quarter of private sector output.
That can’t happen. The wings would fall off first. There would be a bear market in stocks and a depression in the economy – wiping out trillions of dollars of unaffordable debt and unworkable investments.

Total US credit market debt vs. GDP. Even though one is nominal and the other “real” and GDP is an extremely flawed measure of economic activity, there is an unmistakable trend toward more and more debt having to be supported by less and less economic output, via St. Louis Ferderal Reserve Research – click to enlarge.
But let’s see, how does this work? To grow your way out of debt you have to increase income faster than debt. Say you can sustain a healthy rate of GDP growth of 3% a year. That means that additional debt mustn’t exceed 3%.
For 2014, the US fiscal deficit – the gap between what the federal government receives in taxes and what it spends – was 2.8%. It is unlikely to go much lower. That is just the amount borrowed by the feds. The private sector is still two-thirds of the US economy. If it borrowed nothing, debt might contract, relative to the underlying economy.
But without borrowing, the economy will shrink. That is why the feds stepped up to the plate in 2009 and started swinging. The private sector had stopped borrowing. The theory behind Keynesian counter-cyclical policy is that government can offset the lack of private sector demand for credit by borrowing far more than usual.
Over the last five years, the federal government’s counter-cyclical stimulus program added $9 trillion to the nation’s debt. During that time, the private sector scarcely grew at all. Debt can only increase output if it is used to build new productive capacity. If you spend it on Medicaid and wars, it is gone forever.
The private sector ends up with a heavier burden… and a weaker back to carry it. Even when the private sector borrows, it is often merely to boost consumer spending. What’s more, the Fed’s ultra-low lending rates often lure capital into unstable and dangerous investments – such as shale oil or sub-prime auto loans.
So, much of the credit going to the private sector is also wasted. Since the 1970s, private sector growth rates have gone down. Shackled to trillions in debt… duct taped with regulations and restrictions… deceived by phony financial signals from central banks… they will probably remain low and sink lower for the foreseeable future.
Grow your way out of debt? Not likely.

Too Much Debt
But today, we continue with our look at the macro situation at the end of 2014… One way of measuring GDP is to add together consumption, investment, government spending and net exports.The idea is to measure total spending. And in this way, also measure production. Most things produced are sold. Add up how much spending there is and you get an idea of how much production there’s been.
US GDP is reported to be $18 trillion a year – with $3.5 trillion coming from US federal government spending. Add state and local government spending, and the total rises to more than $6 trillion.
This means that the private sector – the part that pays the bills – is only $12 trillion. Total debt – government, corporate and personal – in the US is now $58 trillion (misreported yesterday as $59 trillion… but what’s a trillion dollars between friends?). That’s nearly five times the real economy that supports it.
And it helps explain why it is so hard to “grow your way out” of debt. Assuming an annual interest rate of 2%, even if you could contain debt increases to 3% of GDP a year, the productive part of the economy would have to grow at 5% just to stay even. No developed economy in the world is growing that fast.
At an interest rate of 3%, the annual interest on $58 trillion is $1.7 trillion. That’s slightly less than 10% of GDP. But it’s 14% – or one of every seven dollars – of the private sector economy.
And as recently as January 2002, the 10-year Treasury note yielded over 5%. If the average interest rate were to rise to that level again – and sooner or later it will – it would take $3 trillion to service America’s debt – or one-quarter of private sector output.
That can’t happen. The wings would fall off first. There would be a bear market in stocks and a depression in the economy – wiping out trillions of dollars of unaffordable debt and unworkable investments.

Total US credit market debt vs. GDP. Even though one is nominal and the other “real” and GDP is an extremely flawed measure of economic activity, there is an unmistakable trend toward more and more debt having to be supported by less and less economic output, via St. Louis Ferderal Reserve Research – click to enlarge.
Bigger Burdens, Weaker Backs
That is how nature deals with debt bubbles. But it’s exactly what the Fed wants to avoid. How? By trying to make the economy grow faster, so that debt – as a percentage of output – is less of a burden.But let’s see, how does this work? To grow your way out of debt you have to increase income faster than debt. Say you can sustain a healthy rate of GDP growth of 3% a year. That means that additional debt mustn’t exceed 3%.
For 2014, the US fiscal deficit – the gap between what the federal government receives in taxes and what it spends – was 2.8%. It is unlikely to go much lower. That is just the amount borrowed by the feds. The private sector is still two-thirds of the US economy. If it borrowed nothing, debt might contract, relative to the underlying economy.
But without borrowing, the economy will shrink. That is why the feds stepped up to the plate in 2009 and started swinging. The private sector had stopped borrowing. The theory behind Keynesian counter-cyclical policy is that government can offset the lack of private sector demand for credit by borrowing far more than usual.
Over the last five years, the federal government’s counter-cyclical stimulus program added $9 trillion to the nation’s debt. During that time, the private sector scarcely grew at all. Debt can only increase output if it is used to build new productive capacity. If you spend it on Medicaid and wars, it is gone forever.
The private sector ends up with a heavier burden… and a weaker back to carry it. Even when the private sector borrows, it is often merely to boost consumer spending. What’s more, the Fed’s ultra-low lending rates often lure capital into unstable and dangerous investments – such as shale oil or sub-prime auto loans.
So, much of the credit going to the private sector is also wasted. Since the 1970s, private sector growth rates have gone down. Shackled to trillions in debt… duct taped with regulations and restrictions… deceived by phony financial signals from central banks… they will probably remain low and sink lower for the foreseeable future.
Grow your way out of debt? Not likely.
The legacy – Cartoon by Ramirez
Tent city springs up in shadow of downtown Detroit
The city’s homeless numbers swelled over the past decade as manufacturing and other jobs disappeared and homes were lost during the national foreclosure crisis. About 16,200 of Detroit’s 680,000 residents — almost 2.4 percent — are believed to be living on the streets or in temporary shelters.
 Carlos Osorio/AP Those
who live in this makeshift community of seven tents — believed to be
the only tent city in Detroit — say they have nowhere else to go.
Carlos Osorio/AP Those
who live in this makeshift community of seven tents — believed to be
the only tent city in Detroit — say they have nowhere else to go.DETROIT — Bankruptcy behind it, Detroit’s atmosphere swirls with the promise of better days. Charles Floyd Jones can only hope that the city’s good fortune trickles down to him and the 10 other residents of a tent city that’s sprouted in the shadow of a resurgent downtown where rental occupancy is close to full and restaurants and shops are doing brisk business.
Jones and others in this makeshift community of seven tents — believed to be the only tent city in Detroit — say they have nowhere else to go.
“By us being out of bankruptcy, they can see that you got people out here that’s struggling,” said Jones, 51.
The city’s homeless numbers swelled over the past decade as manufacturing and other jobs disappeared and homes were lost during the national foreclosure crisis. All told, about 16,200 of Detroit’s 680,000 residents, almost 2.4%, are believed to be living on the streets or in temporary shelters — and that doesn’t account for other types of homelessness, such as teens going from friend to friend and families living in motels.
By comparison, only about 1% of San Francisco’s more than 800,000 residents are homeless. But San Francisco is on much firmer financial ground than Detroit, which shed $7 billion in debt during bankruptcy. Its restructuring plan aims to raise revenue and improve city services with $1.7 billion in funding, but it also calls for austerity in budgeting.
“I love Detroit. I’d hope things would get better,” said 29-year-old Josh Reslow, who shares a tent in the encampment with girlfriend Brittney Hines, 25. “I’m a carpenter and with no work going on, I guess, that’s part of the reason I’m on the street.”
The city has “tried to provide” for homeless programs throughout Detroit’s financial crisis and bankruptcy, according to the Rev. Faith Fowler, executive director of the nonprofit Cass Community Social Services. Her nonprofit is one of three that will operate warming centers through the end of March on behalf of the city.
 Carlos Osorio/AP From
left, Josh Reslow, 23, and his girlfriend, Brittney Hines, 25, members
of Detroit's tent city, say they've been homeless for four years.
Carlos Osorio/AP From
left, Josh Reslow, 23, and his girlfriend, Brittney Hines, 25, members
of Detroit's tent city, say they've been homeless for four years. Like others sheltered only by layers of warm clothing beneath canvas tents, Jones “hustles” because he can’t find a steady job. He accepts handouts and makes a few bucks directing fans into downtown parking lots before sporting events. He said he helped start the tent city about two months ago, with others joining later.
“It’s quiet and you really don’t get bothered by too many people,” said Jones, who also lives with his girlfriend and has been homeless for four years.
He isn’t a fan of the rescue mission: “The last time I was there, I got bedbugs. Hopefully, I can find a shelter somewhere that’s presentable and me and my girl can go and make a stay for the winter.”
Lewis Hickson, operations manager of the Neighborhood Service Organization’s Tumaini Center, said his group has dropped off coats at the tent city that can be used as sleeping bags.
“You try to encourage them to come in out of the cold,” Hickson said. “They really don’t like shelter life because of the rules.”
 Carlos Osorio/AP Charles Floyd Jones picks up trash at the tent city on the eastern edge of downtown Detroit.
 “That can then be used to help the city pay for low-cost housing. It will cover a lot of the rent,” said Okin, who wrote about homeless Americans in his book “Silent Voices.”
Nationally, about 85% of the chronically homeless stay in permanent housing once they have access, but Okin warned that it should be supportive housing, with “staff that can help people when they get into trouble.”
Detroit officials have received no complaints about the tent city and have no plans to move them from the park, said Sgt. Michael Woody, a police department spokesman.
“They’re not breaking any laws that are violent in nature or effecting quality of life issues,” Woody said. “If they did want to leave, we would help them with what resources we could muster, but discussions may need to be had soon in finding them something a little more permanent.”
Swiss Central Bank Begins NEGATIVE Interest Rates! Economic Collapse Escalates!
Sources:
“«The monetary system is dangerously unanchored» | International Selection | Finanz und Wirtschaft”
http://www.fuw.ch/article/the-monetar…
“Negative Swiss rates may not take much shine off franc as safe-haven | Reuters”
http://www.reuters.com/article/2014/1…
“Exclusive: ECB considers making weaker euro zone states bear more quantitative easing risk – sources | Reuters”
http://www.reuters.com/article/2014/1…
“Bill Clinton’s drive to increase homeownership went way too far – BusinessWeek”
http://www.businessweek.com/the_threa…
http://confoundedinterest.files.wordp…
“20141219_rufriggingkiddingme.jpg 703×967 pixels”
http://www.zerohedge.com/sites/defaul…
“Report: Immigrant workers account for all employment growth since 2007 | WashingtonExaminer.com”
http://www.washingtonexaminer.com/rep…
“Jamie McGeever on Twitter: “China’s FX reserves are falling, even though its trade surplus is a record high. Via Deutsche: http://t.co/N1mryMoXt4″”
https://twitter.com/ReutersJamie/stat…
http://www.zerohedge.com/sites/defaul…
http://www.zerohedge.com/sites/defaul…
Maybe Oil Goes to $70 on its Way to $40
by Charles Hugh-Smith
A retrace that fills open gaps and kisses the 50-day moving average surprises everyone who was confident oil was heading straight down to $40/barrel.
When the conventional media ordains oil inevitably dropping to $40/barrel, I start looking for something else to happen–like oil going to $70/barrel. There are number of reasons this isn’t as farfetched as it might seem at the moment.
1. The huge gap begging to be filled on the chart of the Energy Select Sector exchange-traded fund XLE and a bunch of other energy-sector stocks and etfs. Gaps like this usually get filled sooner rather than later.
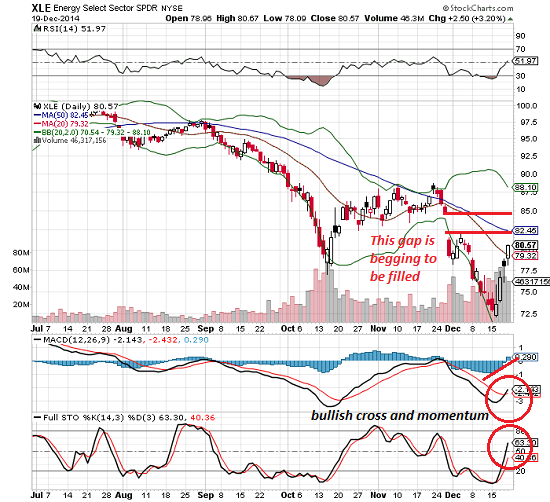
2. A bounce back to the 50-day moving average on the WTI oil index around $73 would be unsurprising. As the old saying has it, nothing goes down in a straight line, and since oil fell in a parabolic curve down, some sort of retrace to a key technical level of resistance is to be expected.
There are many ways to calculate Fibonacci levels, but a retrace to the 38.2% level equates to the mid-$70s.By my reckoning, the natural starting place is the recent high around $116 in 2011 to the recent low around $53. The 38.2% level is $24 + $53 = $77.
Maybe price doesn’t retrace all the way to the mid-$70s, but the possibility shouldn’t be discounted.
3. Too many punters have bet on oil dropping straight to $40/barrel, and all those put options offer the big financial players an incentive to spark a short-covering rally that outruns stops and scoops all the money by options expiration on January 16, 2015.
The more puts there are at $70/barrel (and equivalent levels in energy etfs, oil services stocks, etc., the greater the incentive to push the short-covering rally higher than expected.
4. The parabolic drop in oil resulted more from the panicky unwinding of a crowded and overleveraged trade than supply-demand. As I explained in my series on the financialization of oil, the financial pyramiding of oil is much less visible than supply and demand, so the mainstream media focuses on what’s easy, i.e. supply and demand issues.
The Oil-Drenched Black Swan, Part 4: The Head-Fake Disruption Ahead (December 4, 2014)
The Oil-Drenched Black Swan, Part 3: Multiple Risks, Multiple Unknowns (December 3, 2014)
The Oil-Drenched Black Swan, Part 2: The Financialization of Oil (December 2, 2014)
The Oil-Drenched Black Swan, Part 1 (December 1, 2014)
Crowded trades (trades where almost everyone is on one side of the boat) unwind in precisely this sort of freefall. Once the trade has been unwound, however, the selling cascade exhausts itself and insiders who know better start buying. Buying begets buying, shorts start covering, and voila, a retrace that fills open gaps and kisses the 50-day moving average surprises everyone who was confident oil was heading straight down to $40/barrel.
A retrace that fills open gaps and kisses the 50-day moving average surprises everyone who was confident oil was heading straight down to $40/barrel.
When the conventional media ordains oil inevitably dropping to $40/barrel, I start looking for something else to happen–like oil going to $70/barrel. There are number of reasons this isn’t as farfetched as it might seem at the moment.
1. The huge gap begging to be filled on the chart of the Energy Select Sector exchange-traded fund XLE and a bunch of other energy-sector stocks and etfs. Gaps like this usually get filled sooner rather than later.
2. A bounce back to the 50-day moving average on the WTI oil index around $73 would be unsurprising. As the old saying has it, nothing goes down in a straight line, and since oil fell in a parabolic curve down, some sort of retrace to a key technical level of resistance is to be expected.
There are many ways to calculate Fibonacci levels, but a retrace to the 38.2% level equates to the mid-$70s.By my reckoning, the natural starting place is the recent high around $116 in 2011 to the recent low around $53. The 38.2% level is $24 + $53 = $77.
Maybe price doesn’t retrace all the way to the mid-$70s, but the possibility shouldn’t be discounted.
3. Too many punters have bet on oil dropping straight to $40/barrel, and all those put options offer the big financial players an incentive to spark a short-covering rally that outruns stops and scoops all the money by options expiration on January 16, 2015.
The more puts there are at $70/barrel (and equivalent levels in energy etfs, oil services stocks, etc., the greater the incentive to push the short-covering rally higher than expected.
4. The parabolic drop in oil resulted more from the panicky unwinding of a crowded and overleveraged trade than supply-demand. As I explained in my series on the financialization of oil, the financial pyramiding of oil is much less visible than supply and demand, so the mainstream media focuses on what’s easy, i.e. supply and demand issues.
The Oil-Drenched Black Swan, Part 4: The Head-Fake Disruption Ahead (December 4, 2014)
The Oil-Drenched Black Swan, Part 3: Multiple Risks, Multiple Unknowns (December 3, 2014)
The Oil-Drenched Black Swan, Part 2: The Financialization of Oil (December 2, 2014)
The Oil-Drenched Black Swan, Part 1 (December 1, 2014)
Crowded trades (trades where almost everyone is on one side of the boat) unwind in precisely this sort of freefall. Once the trade has been unwound, however, the selling cascade exhausts itself and insiders who know better start buying. Buying begets buying, shorts start covering, and voila, a retrace that fills open gaps and kisses the 50-day moving average surprises everyone who was confident oil was heading straight down to $40/barrel.
Speculative demand: The buy to rent scheme is in full effect


November existing home sales drop to 4.93 million units, weakest in six months
WASHINGTON (MarketWatch) - Sales of existing homes fell 6.1% in
November to a seasonally adjusted annual rate of 4.93 million, the
National Association of Realtors reported Monday. This is the weakest
level in six months. Economists polled by MarketWatch had expected the
sales rate to decline to 5.18 million in November from an originally
reported 5.26 million in October. November's pace of sales was up 2.1%
from a year earlier. The median sales price of used homes hit $205,300
in November, up 5.0% from the year-earlier period. November's inventory
was 2.09 million existing homes for sale, a 5.1 month supply at the
current sales pace. The number of homes available for sale was up 2.0%
from the year-earlier period.
Read the full story:
Sales of existing homes cool in November
Can The ROTHSCHILD Plan To ENSLAVE HUMANITY Be Stopped? — Michael Noonan
from SGT Report.com:
Our friend Michael Noonan from Edge Trader Plus joins us to discuss the stark economic reality humanity is facing under the iron fist rule of the Rothschild International banking SYSTEM of total control. And despite the inevitable future collapse of the Dollar and the consequent end of U.S. world hegemony, according to Michael, the chances of toppling the Rothschild’s from their seat of world power appear to be slim.
For we wrestle not against flesh and blood, but against principalities, against powers, against the rulers of the darkness of this world, against spiritual wickedness in high places. Ephesians 6:12
Global Financial Markets Just Experienced The Worst Week In 3 Years
Michael Snyder:
Is this the start of the next major financial crisis? The nightmarish
collapse of the price of oil is creating panic in financial markets all
over the planet. On June 16th, U.S. oil was trading at a price of
$107.52. Since then, it has fallen by almost 50 dollars in less than 6
months. This has only happened one other time in our history. In the summer of 2008, the price of oil utterly collapsed and we all remember what happened after that.
Well, the same patterns that we witnessed back in 2008 are happening
again. As the price of oil crashed in 2008, so did prices for a whole
host of other commodities. That is happening again. Once commodities started crashing, the market for junk bonds started to implode. That is also happening again.
Finally, toward the end of 2008, we witnessed a horrifying stock market
crash. Could we be on the verge of another major one? Last week was
the worst week for the Dow in more than three years, and stock markets
all over the world are crashing right now. Bad financial news continues
to roll in from the four corners of the globe on an almost hourly
basis. Have we finally reached the “tipping point” that so many have
been warning about?What we witnessed last week is being described as “a bloodbath” that was truly global in scope. The following is how Zero Hedge summarized the carnage…Have you ever wondered how billionaires continue to get RICHER, while the rest of the world is struggling?"I study billionaires for a living. To be more specific, I study how
these investors generate such huge and consistent profits in the stock
markets -- year-in and year-out."
CLICK HERE to get your Free E-Book, “The Little Black Book Of Billionaires Secrets” I’s 2nd worst week in over 3 years (down 10 of last 11 weeks) Dow’s worst worst week in 3 yearsFinancials worst week in 2 monthsMaterials worst week since Sept 2011VIX’s Biggest week since Sept 2011Gold’s best week in 6 monthsSilver’s last 2 weeks are best in 6 monthsHY Credit’s worst 2 weeks since May 2012IG Credit’s worst week in 2 months10Y Yield’s best week since June 2012US Oil Rig Count worst week in 2 yearsThe USDollar’s worst week since July 2013USDJPY’s worst week since June 2013Portugal Bonds worst week since July 2011Greek stocks worst week since 1987
The stock market meltdown in Greece is particularly noteworthy. After peaking in March, the Greek stock market is down 40 percent since then. That includes a 20 percent implosion in just the past three trading days.And it isn’t just Greece.
Financial markets all over Europe are in turmoil right now. In addition
to crashing oil prices, there is also renewed concern about the
fundamental stability of the eurozone. Many believe that it is
inevitable that it is headed for a break up. As a result of all of this
fear, European stocks also had their worst week in over three years…European stock
markets closed sharply lower on Friday, posting their biggest weekly
loss since August 2011, as commodity prices continued to fall and and
shares in oil-related firms came under renewed pressure from the weak
price for crude.
The pan-European FTSEurofirst
300 unofficially ended 2.6 percent lower, down 5.9 percent on the week
as the energy sector once again weighed heavily on wider benchmarks,
falling over 3 percent.But despite all of the carnage
that we witnessed in the U.S. and in Europe last week, things are
actually far worse for financial markets in the Middle East.Just check out what happened on the other side of the planet on Sunday…Stock markets in
the Persian Gulf got drilled Sunday as worries about further price
declines grew. The Dubai stock index fell 7.6% Sunday,the equivalent of a 1,313-point plunge in the Dow Jones industrial average. The Saudi Arabian market fell 3.3%.Overall, Dubai stocks are down a whopping 23 percent over the last two weeks, and full-blown stock market crashes are happening in Qatar and Kuwait too.Like I said, this is turning out to be a truly global financial panic.Another region to keep an eye
on is South America. Argentina is a financial basket case, the
Brazilian stock market is tanking big time, and the implied probability
of default on Venezuelan debt is now up to 93 percent…Swaps traders are
almost certain that Venezuela will default as the rout in oil prices
pressures government finances and sends bond prices to a 16-year low.Benchmark notes due 2027
dropped to 43.75 cents on the dollar as of 11:35 a.m. in New York, the
lowest since September 1998, as crude extended a bear market decline.
The upfront cost of contracts to insure Venezuelan debt against
non-payment for five years is at 59 percent, bringing the implied probability of default to 93 percent,
the highest in the world.So what does all of this mean for the
future?Are we experiencing a repeat of 2008?Could what is ahead be even
worse than that? Or could this just be a temporary setback?Recently, Howard Hill shared a few things that he looks for to determine whether a major financial crisis is upon us or not…The first condition is a serious market sector correction.According to some participants in the market for energy company bonds and loans, such a correction is already underway and heading toward a meltdown (the second condition). Others are more sanguine, and expect a recovery soon.That
smaller energy companies
have issued more junk-rated debt than their relative size in the economy
isn’t under debate. Of a total junk bond market estimated around $1.2
trillion, about 18% ($216 billion, according to a Bloomberg estimate)
has been issued by energy-related companies. Yet those companies
represent a far smaller share of the economy or stock market
capitalization among the universe of junk-rated companies.If the
beaten-down prices for junk energy bonds don’t stabilize or recover a
bit, we might see the second condition: a spiral of distressed sales of bonds and loans.
This could happen if junk bond mutual funds or other large holders sell
into an unfriendly market at low prices, and then other holders of
those bonds succumb to the pressure of fund redemptions or margin calls
and sell at even lower prices.The third condition, which we can’t determine directly, would bepressure on Credit Default Swap dealers or hedge funds to make deposits as the prices of the CDS move against them.
AIG was taken down when collateral demands were made to support
existing CDS agreements, and nobody knew it until they were going under.
There simply isn’t a way to know whether banks or dealers are
struggling until the effect is already metastasizing.I think that he
makes some really good points.In particular, I think that watching how junk bonds perform over
the next few weeks will be extremely telling.Last week was truly a
bloodbath for high yield debt But perhaps things will stabilize this
week.Let’s hope so, because this is the closest that we have been to
another major financial crisis since 2008.
So what do you think?Join the conversation instantly with Facebook Comments below:This article is brought to you courtesy of Michael Snyder.
So what do you think?Join the conversation instantly with Facebook Comments below:This article is brought to you courtesy of Michael Snyder.
Greece’s radical left could kill off austerity in the EU
Another war looms in Europe: waged not with guns and tanks, but with
financial markets and EU diktats. Austerity-ravaged Greece may well be
on the verge of a general election that could bring to power a
government unequivocally opposed to austerity. Momentous stuff: that has
not happened in the six years of cuts and falling living standards that
followed the collapse of Lehman Brothers.
But if the radical leftist party Syriza does indeed triumph in a possible snap poll in the new year, there will undoubtedly be a concerted attempt to choke the experiment at birth. That matters not just for Greece, but for all of us who want a different sort of society and a break from years of austerity.
What misery has been inflicted on Greece. One in four of its people are out of work; poverty has surged from 23% before the crash to 40.5%; and research has demonstrated how key services such as health have been hammered by cuts, even as demand has risen. No wonder the country has experienced a political polarisation that has prompted comparisons with Weimar Germany. The neo-Nazi Golden Dawn – which makes other European rightist movements look like fluffy liberals – at one point attracted up to 15% in the polls; though still a menace, its support has thankfully subsided to half that.
But unlike many other European societies – with the notable exceptions of Spain and Ireland – fury and despair with austerity has been channelled into the ranks of the populist left. After years on the fringes of Greek politics, Syriza only became a fully fledged party in 2012, and yet it won Greece’s elections to the European parliament earlier this year. The latest opinion polls give Syriza a substantial lead over the governing centre-right New Democracy party. A radical leftwing government could well assume power for the first time in the EU’s history.
After years of social ruin, Syriza is offering Greeks that precious thing: hope. Although it has shifted from demanding an immediate cancellation of debt, it is demanding a negotiated solution. It has conjured up the example of a European debt conference to wipe away a portion of the debt, as happened with Germany in 1953. Syriza’s manifesto proposes that repayment of debt could come through economic growth, rather than from budget cuts. It wants a European new deal backed up by an investment bank; an all-out war against the tax avoidance endemic in Greek society; an emergency employment programme; a raised minimum wage; and the restoration of collective bargaining. In alliance with anti-austerity forces such as Spain’s surging Podemos party, Syriza wants the EU to abandon crippling austerity policies in favour of quantitative easing and a growth-led recovery.
There’s one small catch: the determined opposition of the establishment in both Greece and the EU. Greece was ruled by a hard-right junta, the colonels’ regime of 1967-74, and there is still clearly anti-leftist sentiment deeply embedded in the state. The police have been infiltrated by Golden Dawn elements, with accusations that they have tortured anti-fascist protesters. The head of the bank of Greece has warned of “irreparable damage” to the economy if there is a change of course. Some form of coup – even if more subtle than that executed by the colonels in 1967 – cannot be ruled out.
Source and full story: The Guardian, 22 December 2014
"Houston, You Have A Problem" - Texas Is Headed For A Recession Due To Oil Crash, JPM Warns
It was back in August 2013, when there was nothing but clear skies ahead of the US shale industry that we asked "How Much Is Oil Supporting U.S. Employment Gains?" The answer we gave:

And added the following:

The Institute had this commentary to add:
Which brings us to Texas, the one state that more than any other, has benefited over the past 5 years from the Shale miracle. And now with crude sinking by the day, it is time to unwind all those gains, and give back all those jobs. Did we mention: highly compensated, very well-paying jobs, not the restaurant, clerical, waiter, retail, part-time minimum-wage jobs the "recovery" has been flooded with.
Here is JPM's Michael Feroli explaining why Houston suddenly has a very big problem.
* * *
So perhaps it is finally time to add that footnote to the "unambiguously good" qualified when pundits describe the oil crash: it may be good for everyone... except Texas which is about to enter a recession. And then Pennsylvania. And then North Dakota. And then Colorado. And then West Virginia. And then Alaska. And then Wyoming. And then Oklahoma. And then Montana, and so on, until finally we find just where the new equilibrium is following the exodus of hundreds of thousands of the best-paying jobs created during the "recovery" offset by minimum-wage waiters, bartenders, retail workers and temps.
Two weeks ago we followed up with an article looking at "Jobs: Shale States vs Non-Shale States" in which we showed the following chart:The American Petroleum Institute said last week the U.S. oil and natural gas sector was an engine driving job growth. Eight percent of the U.S. economy is supported by the energy sector, the industry's lobbying group said, up from the 7.7 percent recorded the last time the API examined the issue. The employment assessment came as the Energy Department said oil and gas production continued to make gains across the board. With the right energy policies in place, API said the economy could grow even more. But with oil and gas production already at record levels, the narrative over the jobs prospects may be failing on its own accord.... The API's report said each of the direct jobs in the oil and natural gas industry translated to 2.8 jobs in other sectors of the U.S. economy. That in turn translates to a total impact on U.S. gross domestic product of $1.2 trillion, the study found.

And added the following:
Another way of visualizing the impact of the shale industry on the US economy comes courtesy of this chart from the Manhattan Institute which really needs no commentary:According to a new study, investments in oil and gas exploration and production generate substantial economic gains, as well as other benefits such as increased energy independence. The Perryman Group estimates that the industry as a whole generates an economic stimulus of almost $1.2 trillion in gross product each year, as well as more than 9.3 million permanent jobs across the nation.
The ripple effects are everywhere. If you think about the role of oil in your life, it is not only the primary source of many of our fuels, but is also critical to our lubricants, chemicals, synthetic fibers, pharmaceuticals, plastics, and many other items we come into contact with every day. The industry supports almost 1.3 million jobs in manufacturing alone and is responsible for almost $1.2 trillion in annual gross domestic product. If you think about the law, accounting, and engineering firms that serve the industry, the pipe, drilling equipment, and other manufactured goods that it requires, and the large payrolls and their effects on consumer spending, you will begin to get a picture of the enormity of the industry.

The Institute had this commentary to add:
Fast forward to today when we are about to learn that Newton's third law of Keynesian economics states that every boom, has an equal and opposite bust.The jobs recovery since the 2008 recession has been the slowest of any post recession recovery in the U.S. since World War II. The number of people employed has yet to return to the 2007 level. The country has suffered a deeper and longer-lasting period of job loss than has followed any of the ten other recessions since 1945.
There has, however, been one employment bright spot: jobs in America’s oil & gas sector and related industries. Since 2003, more than 400,000 jobs have been created in the direct production of oil & gas and some 2 million more in indirect employment in industries such as transportation, construction, and information services associated with finding, transporting, and storing fuels from the new shale bounty.
In addition, America is seeing revitalized growth and jobs in previously stagnant sectors of the economy, from chemicals production and manufacturing to steel and even textiles because of access to lower cost and reliable energy.
...
The surge in American oil & gas production has become reasonably well-known; far less appreciated are two key features, which are the focus of this paper: the widespread geographic dispersion of the jobs created; and the fact that the majority of the jobs have been created not in the ranks of the Big Oil companies but in small businesses, even more widely dispersed.
Which brings us to Texas, the one state that more than any other, has benefited over the past 5 years from the Shale miracle. And now with crude sinking by the day, it is time to unwind all those gains, and give back all those jobs. Did we mention: highly compensated, very well-paying jobs, not the restaurant, clerical, waiter, retail, part-time minimum-wage jobs the "recovery" has been flooded with.
Here is JPM's Michael Feroli explaining why Houston suddenly has a very big problem.
* * *
* * *The collapse in oil prices will create winners and losers, both globally and here in the US. While we expect the country, overall, will be a net beneficiary from falling oil prices, two states look like they will bear the brunt of the pain: North Dakota and Texas. Given its much larger size, the prospect of a recession in Texas could have some broader reverberations.
- In less than five years Texas’ share of US oil production has gone from around 25% to over 40%
- By some measures, the oil intensity of the Texas economy looks similar to what it was in the mid-1980s
- The 1986 collapse in oil prices led to a painful regional recession in Texas
- While the rest of the country looks to benefit from cheap oil, Texas could be headed for recession
By now, most people are familiar with the growth of the fossil fuel industry in places like Pennsylvania and Ohio. However, that has primarily been a natural gas story. The renaissance of US crude oil production has been much more concentrated: over 90% of the growth in the past five years has been in North Dakota and Texas; with Texas alone accounting for 67% of the increase in the nation’s crude output over that period.
In the first half of 1986, crude oil prices fell just over 50%. At the end of 1985, the unemployment rate in Texas was equal to that in the nation as a whole; at the end of 1986 it was 2.6%- points higher than the national rate. There are some reasons to think that it may not be as bad this time around, but there are even better reasons not to be complacent about the risk of a regional recession in Texas.

Geography of a boom
The well-known energy renaissance in the US has occurred in both the oil and natural gas sectors. Some states that are huge natural gas producers have limited oil production: Pennsylvania is the second largest gas producing state but 19th largest oil producer. The converse is also true: North Dakota is the second largest crude producer but 14th largest gas producer. However, most of the economic data as it relates to the energy sector, employment, GDP, etc, often lump together the oil and gas extraction industries. Yet oil prices have collapsed while natural gas prices have held fairly steady. To understand who is vulnerable to the decline in oil prices specifically we turn to the EIA’s state-level crude oil production data.
The first point, mentioned at the outset, is that Texas, already a giant, has become a behemoth crude producer in the past few years, and now accounts for over 40% of US production. However, there are a few states for which oil is a relatively larger sector (as measured by crude production relative to Gross State Product): North Dakota, Alaska, Wyoming, and New Mexico. For two other states, Oklahoma and Montana, crude production is important, though somewhat less so than for Texas. Note, however, that these are all pretty small states: the four states where oil is more important to the local economy than Texas have a combined GSP that is only 16% of the Texas GSP. Finally, there is one large oil producer, California, which is dwarfed by such a huge economy that its oil intensity is actually below the national average, and we would expect it, like the country as a whole, to benefit from lower oil prices.
Texas-sized challenges
As discussed above, Texas is unique in the country as a huge economy and a huge oil producer. When thinking about the challenges facing the Texas economy in 2015 it may be useful, as a starting point, to begin with the oil price collapse of 1986. Then, like now, crude oil prices collapsed around 50% in the space of a few short months. As noted in the introduction, the labor market response was severe and swift, with the Texas unemployment rate rising 2.0%-points in the first three months of 1986 alone. Following the hit to the labor market, the real estate market suffered a longer, slower, burn, and by the end of 1988 Texas house prices were down over 14% from their peak in early 1986 (over the same period national house prices were up just over 14%). The last act of this tragedy was a banking crisis, as several hundred Texas banks failed, with peak failures occurring in 1988 and 1989.
How appropriate is it to compare the challenges Texas faces today to the ones they faced in 1986? The natural place to begin is by getting a sense of the relative energy industry intensity of Texas today versus 1986. Unfortunately, the GSP-by-industry data have a definitional break in 1997, but splicing the data would suggest a similar share of the oil and gas sector in Texas GSP now and in 1985: around 11%. Employment in the mining and logging sector (which, in Texas, is overwhelmingly dominated by the oil and gas sector) was around 3.7% in 1985 and is 2.7% now. This is consistent with a point we have been making in the national context: the oil and gas sector is very capital-intensive, and increasingly so. Even so, as the 1986 episode demonstrated, there do seem to be sizable multiplier effects on non-energy employment. Finally, there does not exist capital spending by state data, but at the national level we can see the flip side of the increasing capital intensive nature of energy: oil and gas related cap-ex was 0.58% of GDP in 4Q85, and is 0.98% of GDP now.
Given this, what is the case for arguing that this time is different, and the impact will be smaller than in 1986? One is that now, unlike in 1986, natural gas prices haven’t moved down in sympathy with crude oil prices, and the Texas recession in 1986 may have owed in part also to the decline in gas prices. Another is that, as noted above, the employment share is somewhat lower, and thus the income hit will be felt more by capital-holders – i.e. investors around the country and the world. Finally, unlike 1986, the energy industry is experiencing rapid technological gains, pushing down the energy extraction cost curve.
While these are all valid, they are not so strong as to signal smooth sailing for the Texas economy. Financially, oil is a fair bit more important than gas for Texas, both now and in 1986, with a dollar value two to three times as large. Moreover, while energy employment may be somewhat smaller now, we are not talking about night and day. The current share is about 3/4ths what it was in 1986. (Given the higher capital intensity, there are some reasons to think employment may be greater now in sectors outside the traditional oil and gas sectors, such as pipeline and heavy engineering construction).
As we weigh the evidence, we think Texas will, at the least, have a rough 2015 ahead, and is at risk of slipping into a regional recession. Such an outcome could bring with it the usual collateral damage that occurs in a slowdown. Housing markets have been hot in Texas. Although affordability in Texas looks good compared to the national average, it always does; compared to its own history, housing in some major Texas metro areas looks quite dear, suggesting a risk of a pull-back in the real estate market.
The national economy performed quite well in 1986, in spite of the Texas recession. We expect the US economy will perform well next year too , though some regions – most notably Texas – could significantly underperform the national average.

So perhaps it is finally time to add that footnote to the "unambiguously good" qualified when pundits describe the oil crash: it may be good for everyone... except Texas which is about to enter a recession. And then Pennsylvania. And then North Dakota. And then Colorado. And then West Virginia. And then Alaska. And then Wyoming. And then Oklahoma. And then Montana, and so on, until finally we find just where the new equilibrium is following the exodus of hundreds of thousands of the best-paying jobs created during the "recovery" offset by minimum-wage waiters, bartenders, retail workers and temps.
Democrats Bow Down to Wall Street
John R. MacArthur of Harper’s Magazine says that Republicans and Democrats alike are abandoning the republic in pursuit of big bucks.
 egotiators
from the 12-nation Trans-Pacific Partnership (TPP) are in Washington
this week for a new round of talks which they hope will lead them closer
to agreement on the trade deal. President Obama has called passage of
TPP a “high priority.”
egotiators
from the 12-nation Trans-Pacific Partnership (TPP) are in Washington
this week for a new round of talks which they hope will lead them closer
to agreement on the trade deal. President Obama has called passage of
TPP a “high priority.”
This week, Bill speaks with outspoken veteran journalist John R. MacArthur, president and publisher of Harper’s Magazine,
about the problems with TPP, which is being negotiated in secret,
behind closed doors. MacArthur says that the “free trade” agreement will
take jobs away from Americans: “I guarantee you, this is a way to send
more jobs [abroad], particularly to Vietnam and Malaysia.”
Obama’s commitment to trade is just another example of
his indebtedness to Wall Street for massive campaign contributions.
Hillary Clinton, who MacArthur describes as to the right of Americans’
political beliefs, may be scaring off progressives looking to run in
2016 as she is “very much in harmony” with Wall Street.
“There are a lot of people who would make good candidates, but they’re intimidated by the Clinton fundraising machine.”
Drilling Our Way Into Oblivion: Shale Was About Land Gambling With Cheap Debt, Not Technological Miracles
Submitted by Raul Ilargi Meijer of The Automatic Earth blog,
Oh, that sweet black gold won’t leave us alone, will it? West Texas Intermediate went through some speedbumps Friday, but ended over +5%, though still only at $57. Think them buyers know something we don’t? I don’t either. I see people covering lousy bets. And PPT (and that’s not the one we used to spray our crops with).
The damage done must be epic by now, throughout the financial system, but we’re not hearing much about that yet, are we? We will in time, not to worry. Everyone’s invested in oil, and big time too, and they’ve all just become party to a loss of about half of what both oil itself and oil stocks were worth just this summer.
There’s those who can ride it out and wait for sunnier days, but many funds don’t have that luxury. Who wants to be manager of Norway’s huge oil-based sovereign fund these days? With all these long-term obligations entered into when oil was selling for $110, no questions asked? The Vikings must be selling assets east, west, left and right. But they’re not going to tell us, not if they can help it.
Just like all the other money managers who pray every morning and night on their weak knees for this nightmare to pass. Your pension fund, your government, they’re all losing. BIG. They’ll try and hide those losses as long as they can. But trust me on this one: all major funds have oil in a prominent place in their portfolios. And there’s a Bloomberg index that says the average share values of 76 North American oil companies, i.e. not just the price of oil, have lost 49% of their value since June. There will be Blood with a capital B.
The discussions over the past few weeks have all been about OPEC, whether they would cut output or not. And I’m not really getting that. There are 3 major producers today, you might even label them swing producers: Saudi Arabia, Russia, and the US. But all the talk is always about OPEC cutting. What about Russia? Well, they can’t really, can they, with all the sanctions and the threat they are to the ruble. Russia must produce full tilt just to make up for those sanctions. The Saudis know that if they cut, other producers, OPEC or not, will fill in the gap they leave behind. At $55 a barrel, everyone’s desperate. Therefore, the Saudis are not cutting, because it would only cost them market share, and prices still wouldn’t rise.
So why does everyone in the western media keep talking about OPEC cutting output, and not the US, just as the same everyone is so proud of saying the US challenges the Saudis for biggest producer status?! Why doesn’t the US cut production? It’s almost as big as Saudi Arabia, after all. Why doesn’t Washington order the (shale) oil patch to tone it down, instead of having everyone talk about OPEC? I know, energy independence and all that, but it’s still a curious thing. Want to save the shale patch? Cut it down to size.
Anyway, this is what we have on offer: the oil industry faces a triple whammy. Oil prices are down 50%, oil company share valuations are also down 50%, and their production costs are rising, in quite a few cases exponentially so. That’s what they, and we, face while slip-sliding into the new year. Do I need to explain that that does not bode well? Let’s do a news round. Starting with Bloomberg on how the shale boys are stumbling over their hedges and other ‘insurance’ policies. All you really need to know is: “Producers are inherently bullish ..” And then you can take it from there.
Tumbling oil prices have exposed a weakness in the insurance that some U.S. shale drillers bought to protect themselves against a crash. At least six companies, including Pioneer Natural Resources and Noble Energy, used a strategy known as a three-way collar that doesn’t guarantee a minimum price if crude falls below a certain level, according to company filings. While three-ways can be cheaper than other hedges, they can leave drillers exposed to steep declines.Where does this turn from insurance to casino, right? It’s a blurred line. Nobody worried about that as long as prices were NOT $55 a barrel. But now they have to. Pioneer gets $68.55 a barrel. Big deal. That’s still well over 30% less than in June.
“Producers are inherently bullish,” said Mike Corley, of Mercatus Energy Advisors. “It’s just the nature of the business. You’re not going to go drill holes in the ground if you think prices are going down.” [..] Shares of oil companies are also dropping, with a 49% decline in the 76-member Bloomberg Intelligence North America E&P Valuation Peers index from this year’s peak in June. The drilling had been driven by high oil prices and low-cost financing.
Companies spent $1.30 for every dollar earned selling oil and gas in the third quarter, according to data compiled by Bloomberg on 56 of the U.S.-listed companies in the E&P index. Financing costs are now rising as prices sink.
The average borrowing cost for energy companies in the U.S. high-yield debt market has almost doubled to 10.43% from an all-time low of 5.68% in June, Bank of America Merrill Lynch data show. [..]
Pioneer, one of the biggest U.S. shale oil producers, used three-ways to cover 85% of its projected 2015 output, the company’s December investor presentation shows. The strategy capped the upside price at $99.36 a barrel and guaranteed a minimum, or floor, of $87.98. By themselves, those positions would ensure almost $34 a barrel more than yesterday’s price.
However, Pioneer added a third element by selling a put option, sometimes called a subfloor, at $73.54. That gives the buyer the right to sell oil at that price by a specific date. Below that threshold, Pioneer is no longer entitled to the floor of $87.98, only the difference between the floor and the subfloor, or $14.44 on top of the market price. So at yesterday’s price of $54.11, Pioneer would realize $68.55 a barrel.
In Europe, oil is a big issue too. They still have some of the stuff there after all. And that too has halved in value. North Sea oil is a large part of total UK tax revenues, but it’s also energy independence. And already there are people saying that the entire industry is dying.
The UK’s oil industry is in “crisis” as prices drop, a senior industry leader has told the BBC. Oil companies and service providers are cutting staff and investment to save money. Robin Allan, chairman of the independent explorers’ association Brindex, told the BBC that the industry was “close to collapse”. Almost no new projects in the North Sea are profitable with oil below $60 a barrel, he claims. “It’s almost impossible to make money at these oil prices”, Mr Allan, who is a director of Premier Oil in addition to chairing Brindex, told the BBC.400,000 people work in the industry in the UK, plus at least twice as many in supporting fields, and most of those jobs are in Scotland. Not good.
“It’s a huge crisis.” “This has happened before, and the industry adapts, but the adaptation is one of slashing people, slashing projects and reducing costs wherever possible, and that’s painful for our staff, painful for companies and painful for the country. “It’s close to collapse. In terms of new investments – there will be none, everyone is retreating, people are being laid off at most companies this week and in the coming weeks. Budgets for 2015 are being cut by everyone.”
His remarks echo comments made by the veteran oil man and government adviser Sir Ian Wood, who last week predicted a wave of job losses in the North Sea over the next 18 months. US-based oil giant ConocoPhillips is cutting 230 out of 1,650 jobs in the UK. This month it announced a 20% reduction in its worldwide capital expenditure budget, in response to falling oil prices.
Other big oil firms are expected to make similar cuts to their drilling and exploration budgets. Research from Goldman Sachs predicted that they would need to cut capital expenditure by 30% to restore their profitability at current prices. Service providers to the industry have also been hit. Texas-based oilfield services company Schlumberger cut back its UK-based fleet of geological survey ships in December, taking an $800m loss and cutting an unspecified number of jobs.
[..] .. as a lot of production ceases to make money below $80 barrel (it’s now in the region of $63), North Sea producers and those in their supply chain now face pressure to cut costs sharply. Those costs have been rising steeply in recent years. And measured per barrel of production, they’ve been rising at an alarming rate.
And it’s not going to stop either, as the following Bloomberg piece makes crystal clear, and for obvious reasons. Once you’ve dug a well, you have to squeeze it for all you got. Makes perfect sense to me.
But… A 42-year record in US domestic production just as prices plummet by 50%, that has to be a game changer. And then you run into problems.
Crude oil production from U.S. wells is poised to approach a 42-year record next year as drillers ignore the recent decline in price pointing them in the opposite direction. U.S. energy producers plan to pump more crude in 2015 as declining equipment costs and enhanced drilling techniques more than offset the collapse in oil markets, said Troy Eckard, whose Eckard Global owns stakes in more than 260 North Dakota shale wells.Things run fine at existing wells. Prices get governments in Russia and other producers into trouble, but most can catch that fall up to a point. In the US shale patch, it’s a different story, because there it’s not like once you’ve drilled a well, you can move for years to come. Saudi’s famed Ghawar field has been gushing for 60 years. Shale wells deplete 80-90% in just two years.
Oil companies, while trimming 2015 budgets to cope with the lowest crude prices in five years, are also shifting their focus to their most-prolific, lowest-cost fields, which means extracting more oil with fewer drilling rigs, said Goldman Sachs. Global giant Exxon Mobil, the largest U.S. energy company, will increase oil production next year by the biggest margin since 2010. [..]
“Companies that are already producing oil will continue to operate those wells because the cost of drilling them is already sunk into the ground,” said Timothy Rudderow, who manages $1.5 billion as chief investment officer at Mount Lucas Management. “But I wouldn’t want to have to be making long-term production decisions with this kind of volatility.”[..] U.S. oil production is set to reach 9.42 million barrels a day in May, which would be the highest monthly average since November 1972, according to the Energy Department..
Existing wells remain profitable even as benchmark crude futures hover near the $55-a-barrel mark because operating costs going forward are usually $25 or less, Tom Petrie, chairman of Petrie Partners said. That’s why prices that have tumbled 47% from this year’s peak on June 20 haven’t prompted any American oil producers to shut down wells, said Petrie. The average cost to operate an existing well in most parts of the U.S. “is about $20 a barrel,” Petrie said. [..] Until you dip into that and start losing money on a cash basis day in, day out, you don’t think about shutting in” wells.
Once oil companies sink cash into drilling wells, lining them with steel pipes and concrete, blasting the surrounding rocks into rubble with hydraulic fracturing, and linking them to pipeline systems, they have no incentive to scale back production, said Andrew Cosgrove, an analyst at Bloomberg. Those investments, which represent “sunk costs,” are no longer a drain on cash flow, Cosgrove said. Instead, they generate capital companies use to repay debt, fund additional drilling, pay out dividends and buy back shares, he said.
Exxon Chairman and CEO Rex Tillerson pledged in March to raise output by an annual average of 2% to 3% during the 2015-2017 period.
It’s like comparing a business that can keep durable goods in stock for years, with one that has only perishables and needs to move them ASAP. A whole different business model, but operating in the same market, and competing for the same customers.
The shale patch can exist in its present form only if it has access to nigh limitless credit, and only if prices are in the $100 or up range. Wells in the patch deplete faster than you can say POOF, and drilling new wells costs $10 million or more a piece. Without access to credit, that’s simply not going to happen.
Don’t forget, shale companies came into the ‘new lower price era’ with big debt issues already in place – borrowing well over $100 billion more annually than they earned, for at least 3 years running, and then in Q3 2014 they spent ‘$1.30 for every dollar earned selling oil and gas’ according to Bloomberg’s E&P index.
Q3 is July, August and September. On July 1, WTI traded at $106. On September 30, it still did $91. And in those days, at those prices, the industry bled $1.30 for every dollar earned. What is that ratio today? $2 spent for every $1 earned? $2.50? More? That is not a different business model, that is not a business model at all.
Existing wells, those already drilled, will be allowed to be emptied, but then it’s over. Who’s going to continue to pump millions upon millions into something that’s a guaranteed loss? Nobody. And not only that, but lenders will start calling in their loans, and issue margin calls. “The average borrowing cost for energy companies in the U.S. high-yield debt market has almost doubled to 10.43% from an all-time low of 5.68% in June”, says BoAML.
That’s about all we need to know. Shale was never a viable industry, it was all about gambling on land prices from the start. And now that wager is over, even if the players don’t get it yet. So strictly speaking my title is a tad off: we’re not drilling our way into oblivion, the drilling is about to grind to a halt. But it will still end in oblivion.
ALERT: Belarus currency panic-‘December insanity’- blocks online sites and closes shops
ALERT: Belarus currency panic-December insanity blocks online sites and closes shops
http://www.theguardian.com/world/2014…
http://www.theguardian.com/world/2014…
Central Banks Secretly Controlling all Futures Prices, Destroy Our Markets & Democracy – Chris Powell
Chris Powell of the Gold Anti-Trust
Action Committee (GATA) says the evidence is clear that central banks
are intervening in all futures markets. Powell charges, “The documents
don’t prove that any particular central bank is trading any particular
futures contract on any given day, but they do show the central banks
are trading secretly in all U.S. futures markets. That means our market
economy has been destroyed. It really means our democracy has been
destroyed because they don’t tell us what they are doing. This is a real
failure of financial journalism. In fact, I argue that the greatest
asset of central banks is not their power of infinite money creation
right now, it is their power to control financial journalism.”
Powell also contends, “GATA wants free and transparent markets and limited and accountable government, at least, in the western world. We are not a gold standard organization. We are not arguing that gold and silver prices ought to be anywhere in particular, but the logic of our research is that there is a vast un-coverable short position in the monetary metals, a fractional gold and silver backing system that essentially is being underwritten secretly by central banks, and the logic of that research is the free market price of the monetary metals is multiples of where they are now.”
Join Greg Hunter of USAWatchdog.com as he goes One-on-One with Chris Powell of the Gold Anti-Trust Action Committee (GATA).
http://usawatchdog.com/central-banks-…
In Boon to Fast Food Strikes, NLRB Goes After McDonald's for 'Violating Workers' Rights'

Marking another victory for fast food workers who have staged strikes and protests across the United States, the National Labor Relations Board announced Friday it is taking joint legal action against McDonald's Corporation and several franchisees for violating employees' rights to organize.The NLRB declared in a press release released Friday that it is issuing 13 complaints involving 78 charges of alleged wrongdoing against the fast food giant for "taking actions against [workers] for engaging in activities aimed at improving their wages and working conditions, including participating in nationwide fast food worker protests about their terms and conditions of employment during the past two years."Violations include: "discriminatory discipline, reductions in hours, discharges, and other coercive conduct directed at employees in response to union and protected concerted activity, including threats, surveillance, interrogations, promises of benefit, and overbroad restrictions on communicating with union representatives or with other employees about unions and the employees’ terms and conditions of employment," the NLRB states.The NLRB, furthermore, notes that it is treating McDonald's and its franchisees as "joint employers"—striking a blow to the previous efforts of the parent corporation to dodge liability for how its restaurants treat workers.The charges emerged from a growing fast food worker movement, which has organized rolling strikes and protests across the United States and world demanding a $15 dollar minimum wage and the right to organize. Workers have repeatedly called for McDonald's to be held directly accountable for labor violations and poverty wages at franchises.According to Michael Wasser, writing for Jobs With Justice, the NLRB's joint employer classification "is a big deal.""We know McDonald’s sets rigorous operating standards for its franchisees, from menus, to uniforms, to employment practices," writes Wasser. "And we know that they monitor and enforce those standards at the corporate level. McDonald’s therefore shouldn’t be able to walk away when those practices appear to run afoul of the law."McDonald's immediately released a statement saying it will "contest the joint employer allegations as well as the unfair labor practice charges in the proper forums."But Micah Wissinger, an attorney who levied one of the cases on behalf of New York City McDonald's workers, said, "McDonald's and its corporate lobbyists continue to claim that the company has no responsibility for workers at its restaurants, but today's complaint underscores the obvious fact that McDonald's is the boss.""The complaint validates what workers have been saying over and over again—that McDonald's requires franchisees to adhere to such regimented rules and regulations that there's no doubt who's really in charge," Wissinger continued.This story was originally published on Common Dreams.-
Subscribe to:
Posts (Atom)