Since the start of this deep recession back in December of 2007 some 7.2 million jobs have been lost in the official BLS reports. The official non-farm employment has dropped from 138 million to 130 million. Think of it this way, for 21 months we have lost on average over 11,000 jobs per day. As we reach the two year anniversary of this recession not much has changed for the average American. The banking system is still in shambles and the employment picture is still bleak. Yet a surprising revision was made in the recent BLS report. That is, in February of 2010 when revisions are made some additional 824,000 jobs were lost! That is correct, some 824,000 jobs have been lost and these do not show up in the current BLS data.
Take a look at the revision:
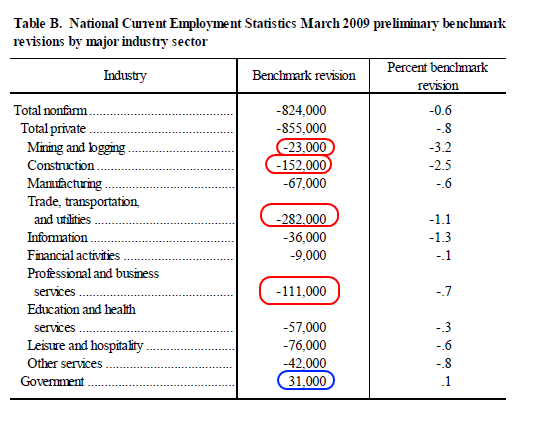
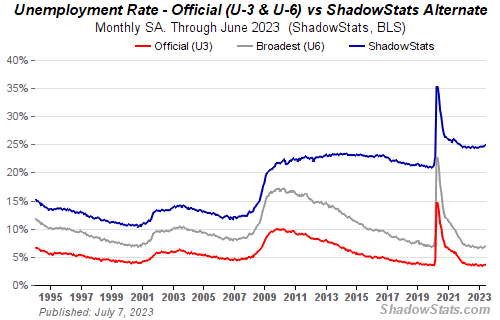
Interestingly enough the only industry that has seen a revision to the upside is in government employment. The U.S. Treasury and Federal Reserve have been pumping trillions into the economy but only into specific sectors. This revision if incorporated today would put the official number of jobs lost during this recession at 8 million, or 10 percent higher than what is being fed in the headline numbers. But the headline number as we all know understates the real problems in our economy. The U-6 data is now at 17 percent and this looks at unemployment and underemployment.
U-6 is an important measure because we are seeing a big leap in part-time employment in this recession. Through furloughs or hours cut, people are losing their purchasing power and given our economy is 70 percent based on consumption this is a vital indicator on whether we move out of recession anytime soon. The average amount of hours worked is still dropping at a steady pace:
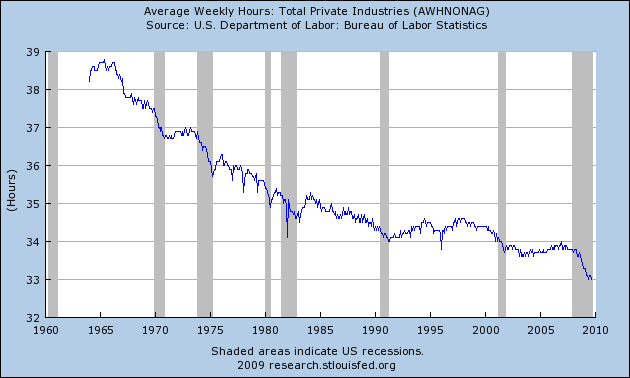
This trend is unmistakable. People are working less and seeing stagnant growth in their wages. Why then would we expect people in this economic climate to be spending more money? The housing bubble occurred in this backdrop and instead of adjusting to the new drop in wages and working conditions people were provided easy credit to create a false economy for a decade.
As you would expect with so many people not working the government is now collecting less money but also, spending more:
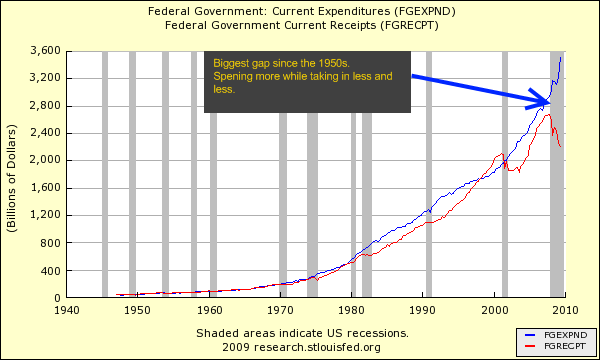
The above chart is probably one of the most important charts that we have. Going back to the late 1940s, never have we seen government spending ramp up this quickly while tax receipts have pulled back. We would have to go back to the Great Depression for data like this. Why is it hard to find data like this for the Great Depression? Not many statistical agencies existed back then. In fact, most of the macro data tracking we now have is because of the Great Depression.
Yet even though some of the government spending during the Great Depression put people back to work today’s government spending is basically a free giveaway to the crony banking system. In fact, the largest amount of money has gone directly into the banks. This isn’t like we put aside $1 trillion for direct job creation. Instead, we have set aside $12 trillion for banks under the pretext of consumer lending and liquidity yet anything but that has occurred:
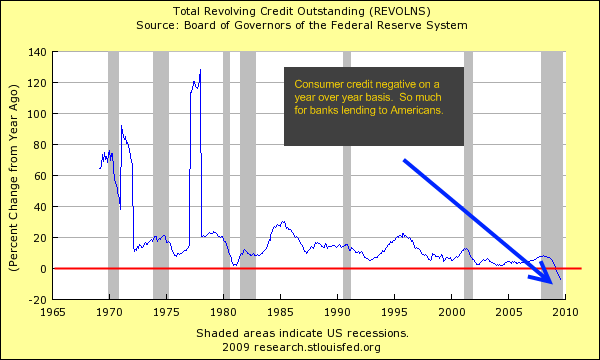
Consumer credit - revolving
For the first time since the 1960s has consumer credit contracted on a year over year basis. The U.S. Treasury and Federal Reserve sold the American people that banks needed money to lend out in the so-called liquidity crisis. What really happened is banks got money to protect themselves from additional losses that they know they will face. We can see this in excess reserves:
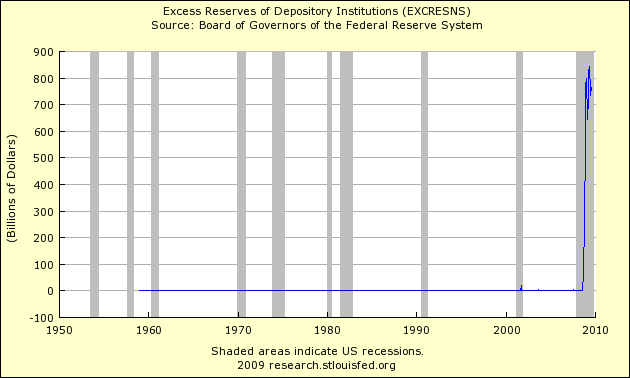
Banks are holding tight to this money because we have many issues coming down the pipeline including the $3 trillion in commercial real estate that will cause further problems. In fact, I have felt this first hand. Instead of getting 15 to 20 credit card offers a week I now get about 2 or 3 a week. Also, I have had my credit line cut back on a couple of credit cards even though I have perfect credit and have never missed a payment. I’m sure many of you are in a similar situation. I have had friends have home equity lines disappear because their home is no longer worth what they once thought it was. The banks stated that they are cutting back because of “a willingness to work with me” and the fact that I have never maxed out my credit cards like a B-list celebrity on Rodeo Drive.
What banks are doing is understandable. They should have been doing this in 2000 and not now when they have taken trillions from taxpayers. I think there will be a tipping point in the near future when the public wakes up from this massive scheme and robbery. Banks realize this and that is why Bank of America and JP Morgan Chase have come out on the overdraft robbery. They are now trying to cut these down but somehow I doubt they’ll give back those billions they have made over the years. This is just a PR stunt.
Yet all of this ties back to the employment report. If we tie in the additional job losses since the start of the recession it would look like this:
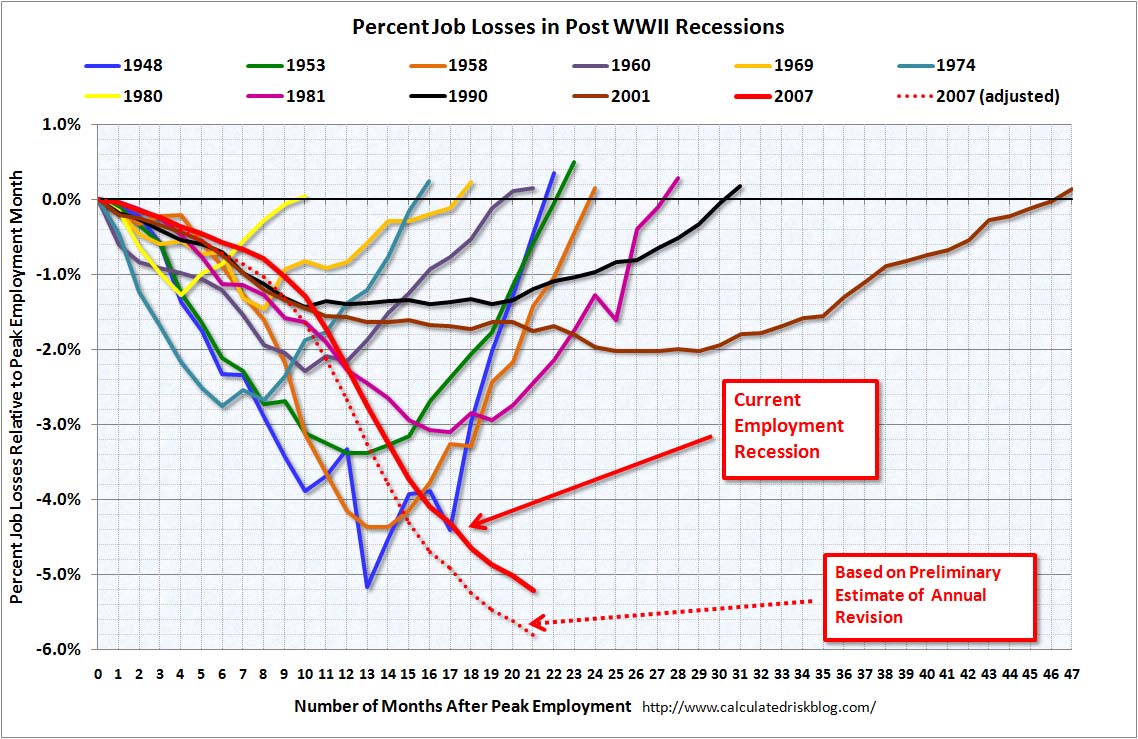
Source: Calculated Risk
Putting all of this together shows a dismal unemployment picture:
And the job losses in this recession are more permanent than in other recession. If we look at how many people have been unemployed for 27 weeks or more, the number is off the charts:
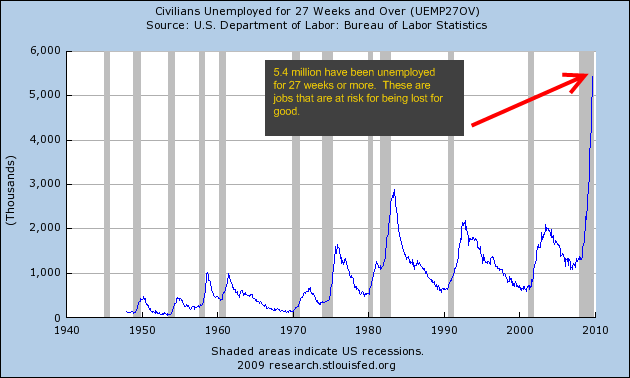
This long term unemployment tells us that we can expect structural changes in our economy for years to come. Someone that has been unemployed for this long is at risk of losing employment in their industry. Just think of all the mortgage brokers, construction workers, and those closely tied to the real estate industry. The only way they will get their jobs back at the peak rate is if we have another housing bubble. That is highly unlikely.
The 824,000 revision is enormous. Historically this revision is off the charts:
“For national CES employment series, the annual benchmark revisions over the last 10 years have averaged plus or minus two-tenths of one percent of total nonfarm employment. The preliminary estimate of the benchmark revision indicates a downward adjustment to March 2009 total nonfarm employment of 824,000 (0.6 percent).”
In other words, the headline numbers don’t tell the real story of the current economic situation.


