Wednesday, April 1, 2015

Gold In Fed Vault Drops Under 6,000 Tons For The First Time, After 10th Consecutive Month Of Redemptions

Tyler Durden: Two months ago, when looking at the most recent physical gold withdrawal numbers reported by the Fed, we observed something peculiar: between the publicly reported surprise redemption by the Netherlands (122 tons) and the just as surprise redemption by the Bundesbank (85 tons), at least 207 tons of gold should have vacated the NY Fed’s gold vault.
Instead, the Fed reported that in all of 2014 “only” 177 tons of gold were shipped out of the massive gold vault located 90 feet below 33 Liberty Street.
Somehow the delta between what we “shipped” and what was “received” in the past year was a whopping 30 tons, or about 15% of the total – a gap that is big enough to make even China’s outright fraudulent trade numbers seems sterling by comparison.

This prompted us to ask:
“what happened? Did an intern input the Fed’s gold redemption’s figures for December, supposedly a different intern than the one who works at the IMF and who caused a stir earlier this week when the IMF, allegedly erroneously, reported that the Dutch – after secretly repatriating 122 tons of gold – had also bought 10 tons of gold in the open market for the first time in nearly a decade.
Or perhaps some “other” bank, central or commercial, decided to offset the redemption’s by the Netherlands and Germany, and inexplicably added 30 tons of gold in December? The question then becomes: “who” deposited said gold, especially when one considers that even the adjoining JPM vault which is allegedly connected to the NY Fed by a tunnel, only contains some 740K ounces of gold, or about 23 tonnes.
Or is it simply that when it comes to accurately reporting the flows of physical gold, classical math is incapable of keeping track of the New Normal gold moves, and the Fed has decided that even when dealing with physical gold there is a “settlement” period?
We still don’t know the answer, and while the Fed has not revised its vault gold data, one thing is clear: the slow, stealthy and steady withdrawal of gold from the NY Fed continues.
According to the most recent earmarked gold data reported by the Fed, in the month of February another 10 tons of gold departed the NY Fed, following 20 tons in the month before - the tenth consecutive month of redemption’s - which if one assumes is merely the delayed relocation of gold previously demanded for delivery, has crossed the Atlantic and is now to be found in Frankfurt.


This means that after 177 tons of gold were withdrawn in 2014 – the largest year of gold redemptions since 2008 when 230 tons of gold departed the NY Fed vault – another 30 tons of parked gold has been recalled to their native lands so far in 2015.


This also means that for the first time in the 21st century the total gold tonnage held at the NY Fed is now under 6000 tons, or 5,989.5 to be precise.
But most importantly it means that all of the 207 tons in Dutch and German withdrawals are now accounted for with a matched and offsetting “departure” at the Fed.
Which is why the next monthly update of the Fed’s earmarked gold will be especially interesting: if March data shows that the withdrawals continue, it will mean that either Germany, or some other sovereign, has continued to redeem their gold which for some reason they no longer trust is safe lying nearly 100 feet below street level on the Manhattan bedrock.

This article is brought to you courtesy of Tyler Durden From Zero Hedge.


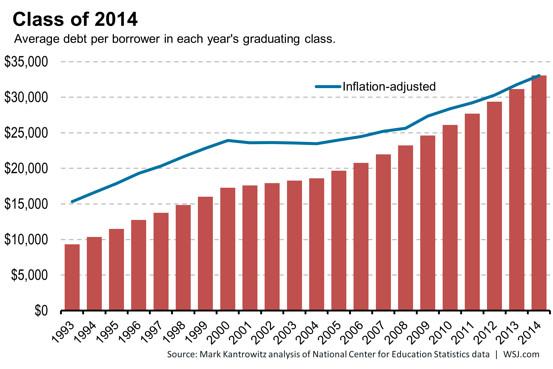
U.S. student-loan delinquency near highest since data started 12 years ago:


What I’m about to tell you is not my own opinion or even analysis. It’s original data that comes from the United States Federal Reserve and national credit bureaus.
  1. 40 million Americans are now in debt because of their university education, and on average borrowers have four loans with a total balance of $29,000.
  2. According to the Fed, “Student loans have the highest delinquency rate of any form of household credit, having surpassed credit cards in 2012.”
  3. Since 2010, student debt has been the second largest category of personal debt, just after a home mortgage.
  4. The delinquency rate for student loans is now hovering near an all-time high since they started collecting data 12 years ago.
  5. Only 37% of total students loan balances are currently in repayment and not delinquent.
The rest—nearly 2 out of 3—are either behind on payments, in all-out default, or have entered some sort of deferral program to delay making payments, with a small percentage still in school.
It’s pretty obvious that this is a giant, unsustainable bubble (more on this below). But even more important are the personal implications.

Embedded image permalink

For the Fed, inflation is way off target.


The Federal Reserve’s preferred measure of inflation in February fell short of the central bank’s 2% target for the 34th straight month.
The price index for personal consumption expenditures was up only 0.3% from a year earlier, the Commerce Department said in Monday. The last reading above 1% came in November.
The oil price crash, a strong dollar and weak overseas economies have all kept inflation at bay. But some slack in the U.S. economy may also be keeping prices muted.
Taking out food and energy, inflation barely firmed to 1.4% from 1.3% in January.
http://blogs.wsj.com/economics/2015/03/30/u-s-inflation-undershoots-the-feds-2-target-for-the-34th-straight-month/

Embedded image permalink

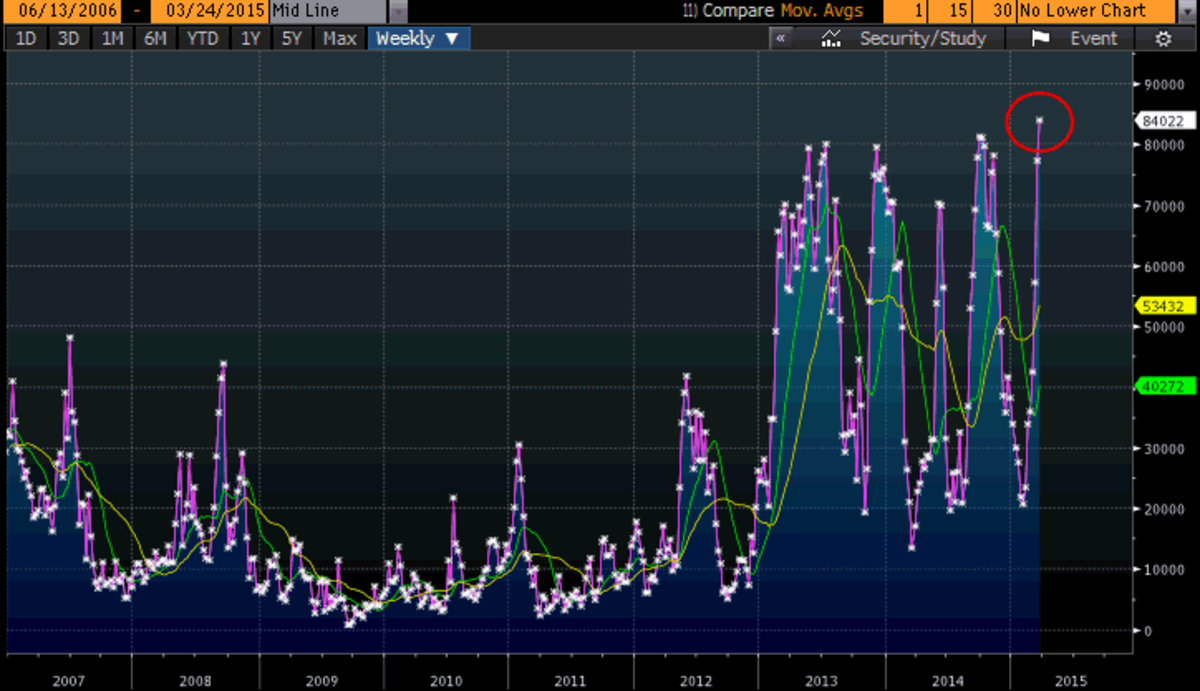
Hedge funds are shorting gold at highest level since 2006


(Bloomberg) — Hedge funds are betting that gold’s recent rally won’t last and are holding the biggest wager ever that prices will decline.
The net-long position in gold dropped by 9.9 percent to 31,653 futures and options in the week ended March 24, according to U.S. Commodity Futures Trading Commission data published three days later. That was the lowest since December 2013. Short holdings rose for a seventh straight week to 84,022 contracts, the highest since the data begins in 2006.
Even as futures climbed for two straight weeks, some investors have shied away from the metal. Global holdings in exchange-traded products backed by bullion declined every week in March. The dollar is headed for the longest run of monthly advances since at least 1967 against a basket of six currencies, lowering demand for gold as an alternative investment.
“Most of the hedge funds are relying on dollar strength as being the primary determining factor in decreasing positions,” Jeff Sica, who oversees $1.5 billion as president and chief executive officer of Circle Squared Alternative Investments in Morristown, New Jersey, said by telephone March 27. “As long as we see dollar strength, you’re going to see the hedge funds get progressively less bullish.”
Most-active futures that rose 4.2 percent in the two weeks through March 27 on the Comex in New York settled 1.3 percent lower at $1,185.30 an ounce in New York on Monday.
http://www.bloomberg.com/news/articles/2015-03-29/hedge-funds-bet-gold-gain-to-fizzle-as-short-wagers-reach-record

https://pbs.twimg.com/media/CBW2A9JWkAEpiqb.png

Measures Warn Of Rising Recession Risks

by Lance Roberts
In this past weekend’s newsletter (click to read and subscribe for free E-delivery), I briefly touched on some corporate profit analysis that I wanted to expand on more today.
Each quarter the Bureau of Economic Analysis releases an update on corporate profits after tax and including inventory adjustments and capital consumption expenditures. According to the latest report:
“Profits from current production (corporate profits with inventory valuation adjustment (IVA) and capital consumption adjustment (CCAdj)) decreased $30.4 billion in the fourth quarter, in contrast to an increase of $64.5 billion in the third. Profits of domestic financial corporations decreased $12.5 billion in the fourth quarter, in contrast to an increase of $16.1 billion in the third.Profits of domestic nonfinancial corporations increased $18.1 billion, compared with an increase of $32.0 billion. The rest-of-the-world component of profits decreased $36.1 billion in the fourth quarter, in contrast to an increase of $16.5 billion in the third.
The deceleration of profitability is a concern as stock prices struggle to move higher as of late. However, what can corporate profitability tell us about the macro environment considering that corporate profits are a reflection of the underlying economic activity?
One easy way to measure this is to look at corporate profits as a percentage of the economy. The chart below is an inflation-adjusted series, and while this is a very rudimentary analysis, it does suggests that corporate profitability, as I recently quoted,is one of the most mean-reverting series in finance.
image: http://streettalklive.com/images/1dailyxchange/2015/Profit-Margins-GDP-StdDev-032315.PNG
Profit-Margins-GDP-StdDev-032315
However, there are many problems with simply looking at corporate profitability as a measure of economic strength. In fact, due to accounting rule changes, surges in repurchase activity and suppressed interest rates, all of which have artificially inflated profits, we also need to consider other measures which may more accurately reflect what is actually occurring within the overall economy.

Return On Equity

As stated, the problems with using corporate profits, particularly forward estimates due to their ongoing adjustments, as a measure of economic strength is somewhat suspect. However, a better historical measure has been Return On Equity or ROE.
ROE is the amount of net income returned as a percentage of shareholders equity and measures a corporation’s underlying health
image: http://images.intellitxt.com/ast/adTypes/icon1.png
by revealing how much profit a company generates with the money shareholders have invested. In other words, looking just at “profits” does not tell us much. However, ROE tells us much more about the underlying usage of those profits from reinvestment to the recycling of capital into dividends and share buybacks. The following chart shows the metric from 1949 through 2014.
image: http://streettalklive.com/images/1newsletter/2015/032715/Profits-ROE-032715.PNG
Profits-ROE-032715
Historically, when there has been a plunge in corporate ROE, a recession has been on the horizon. This makes complete sense as, due to a continued slow growth economy, the expected return from invested capital has fallen to a level that deters corporate appetites.
It is worth noting that the reversion in ROE is occurring from the send highest level in post-WWII history.

Corporate Profits & Dividend

James Montier, via GMO, previously wrote a macro analysis of profits entitled “What Goes Up, Must Come Down” is which he discussed the rather obscure Kalecki profit equation.
“After all, profits are a residual; they are the remainder after the factors of production have been paid. Thus, it can comfortably be argued that the left-hand side of the equation is determined by the right-hand side.
The equation can be generalized to an economy that does have a government sector and in which international trade occurs, and in which the corporate sector does pay some of its profi ts to the household sector. To spare the reader from potentially terminal boredom, I will skip the derivation (to a collective sigh of relief no doubt) and merely present the following:
[Profit] = [Investment] + [Dividends] – [Household Savings] – [Gov’t Saving] – [Foreign Saving]”
However, if we take that equation and divide it by Gross National Product, we can get a better understanding of the relationship between corporate profits and the economy.
[Profit/GNP] = [Investment/GNP] + [Dividends/GNP] – [Household Savings/GNP] – [Gov’t Saving/GNP] – [Foreign Saving/GNP]
This equation shows that if corporations
image: http://images.intellitxt.com/ast/adTypes/icon1.png
“hoard” profits, rather than investing back into the economy via wages and investment, the economy will suffer. This is because the other sectors of the economy lose income. Currently, both corporate profits and dividends as a function of GNP has begun rather sharp declines as economic growth deteriorates and corporations “hoard” profits instead of reinvesting.  Ironically, it is their “hoarding” that is sucking the rest of the economy dry.
image: http://streettalklive.com/images/1newsletter/2015/032715/Profits-Dividends-032715.PNG
Profits-Dividends-032715

Household And Government Savings

Importantly, notice in the Kalecki equation that “household savings” and “Government Savings” are important factors. (For the purpose of this discussion I am going to focus only on the household savings component. However, “Government savings” is the surplus/deficit of Government spending.)
This is because in an economy, total income must equal total expenditures. If a company
image: http://images.intellitxt.com/ast/adTypes/icon1.png
“hoards” all of its profits, pays no taxes and issues no dividends, the economy starves. Economy = [Investment + Dividends] – [Household Savings + Government Savings + Foreign Savings]

When we look at the households share of retained profits and savings as a percentage of GNP, an interesting picture emerges. The blue line in the following chart shows the household savings rate as a percentage of GNP from 1949 to 2014.  The red line shows the housing savings rate as a percentage of GNP adjusted to reflect the household share of retained corporate profits:
image: http://streettalklive.com/images/1newsletter/2015/032715/Profits-HouseholdSavings-032715.PNG
Profits-HouseholdSavings-032715
As you can see, the red line is significantly below its average for the period. Since the mid-1980s, it is fallen by more than 50%. This is consistent with the surge in consumer debt that has been used to offset declining rates of wage growth to maintain an arguably accelerated standard of living. (The U.S. is the only economy in the world where the “poor” have a three bedroom house with a pool.)
From 2009-2013, household savings rates were on the rise. However, over the last year, those savings rates have been drawn down sharply to order to maintain expenditures and avert a recession in the presence of persistently high-profit margins.
As Jesse Livermore explained:
“When you hear claims that record-high corporate profits are coming at the cost of record low household savings, remember that the wealth in question is ultimately fungible. When it shifts from household “saving”, as defined in NIPA, to corporate profit, it’s not disappearing from the household balance sheet–rather, it’s going from one part of the household balance sheet (the bank account) to another part (the brokerage account).”
However, the magnitude of the decline suggests that families have shifted a large chunk of their savings to maintain current economic stability. However, such actions come at a cost, and historically have been a leading indicator of much slower economic growth rates in the future.
The sharp decline in real household savings rates as a percentage of GNP also clears up the question as to why falling gasoline prices have not spurred a sharp increase in consumption. With the majority of households effectively living paycheck-to-paycheck any extra “savings” is simply absorbed into maintaining a strained cost of living.
I am not suggesting that a recession is imminent. I am warning that there are a host of signs as of late, including price momentum and internal deteriorion in the financial markets, that suggests the risks are rising.

Celente: The Republicans and Democrats are thieves and murderers


SGT Report
Our favorite economic and trends analyst in the world, Gerald Celente from the TRENDS JOURNAL returns to SGT Report to discuss the current state of affairs in the United States and beyond. SGT Report contributor Mark S. Mann also joins in on the conversation.
As for our elected “representatives”, the Republicans and Democrats, Gerald says, “They’re murderers and thieves. They murder millions of people in the name of bringing ‘freedom and democracy’ to a country near you, and steal our money in the name of too big to fail bailouts, loan guarantees, special tax breaks and other dirty deals – and the people KNOW IT.”
As we dive deeper into the interview, Mark asks Gerald about Benjamin Netanyahu’s recent speech in front of the US Congress and the $6 BILLION in “aid” the US government gives to Israel annually, Gerald explains that Israel is a nuclear power and an apartheid state – and sounding a lot like Dr. Ron Paul, Celente explains, “I’m against giving money to Israel as I am against giving it to any other country. This country is rotting in front of us. The infrastructure stinks. The country’s going downhill. I don’t want my money going to Israel, to Italy, to Ireland, I don’t want it going anywhere. And when you talk about Israel, the people try to attack you with this cheap BS line of ‘anti-Semitism,’. Let’s get this straight: Israel’s a country, it’s not a religion.”
Buckle up as we spend the next half-hour with the number one trend’s forecaster in the world.
Video Source: SGTreport.com/YouTube
This article originally appeared on SGT Report.
Continue to Intellihub main page

The Accumulation of Debt – The Economic Collapse – Max Keiser


The Rise of the Working Poor and the Non-Working Rich

Many believe that poor people deserve to be poor because they’re lazy. As Speaker John Boehner has said, the poor have a notion that “I really don’t have to work. I don’t really want to do this. I think I’d rather just sit around.”
In reality, a large and growing share of the nation’s poor work full time — sometimes 60 or more hours a week — yet still don’t earn enough to lift themselves and their families out of poverty.
It’s also commonly believed, especially among Republicans, that the rich deserve their wealth because they work harder than others.
In reality, a large and growing portion of the super-rich have never broken a sweat. Their wealth has been handed to them.
The rise of these two groups — the working poor and non-working rich — is relatively new. Both are challenging the core American assumptions that people are paid what they’re worth, and work is justly rewarded.
Why are these two groups growing?
The ranks of the working poor are growing because wages at the bottom have dropped, adjusted for inflation. With increasing numbers of Americans taking low-paying jobs in retail sales, restaurants, hotels, hospitals, childcare, elder care, and other personal services, the pay of the bottom fifth is falling closer to the minimum wage.
Read more

Half of U.S. Households Struggle to Save Even a Few Cents

What’s really in your 401(k)
 Visit nbcnews.com
Brother, can you spare a nickel? For roughly half of American households they answer is “barely,” according to the results of a new survey by Bankrate.com. About half reported they are setting aside no more than 5 percent of their income in savings. One in five said they’re not even able to save a penny.
The highest savings rates were reported by those in the middle of the income ladder; more than a third of households earnings between $50,000 – 75,000 said they’re saving more than 10 percent of their incomes, a higher rate than those in the highest-income bracket. Only a quarter of those surveyed are setting aside more than 10 percent of their incomes, including one in seven who said they are saving more than 15 percent of what they make.
http://www.nbcnews.com/business/personal-finance/half-u-s-households-struggle-save-even-few-cents-n332486

“After years of spending as if there were no tomorrow, consumers are now saving like there is a tomorrow”

"After years of spending as if there were no tomorrow, consumers are now saving like there is a tomorrow" http://on.wsj.com/1NuAEAe 
 
Americans are squirreling away most of the money they’re getting from slowly rising incomes and cheaper gasoline.
The personal saving rate rose to 5.8% in February, the highest level in more than two years, the Commerce Department said Monday.
The rate measures the percentage of disposable income Americans don’t spend. In absolute dollar terms, the figure was a seasonally adjusted $768.6 billion, also the highest level since December 2012–when new taxes set for 2013 skewed the numbers.  As recently as November, the rate was only 4.4%.
The latest saving figures suggest households have been cautious, opting to build up their rainy-day funds. Consumer spending during February rose a weak 0.1% while disposable incomes–personal income after taxes–advanced 0.4%.
http://blogs.wsj.com/economics/2015/03/30/americans-are-saving-more-but-for-how-much-longer/


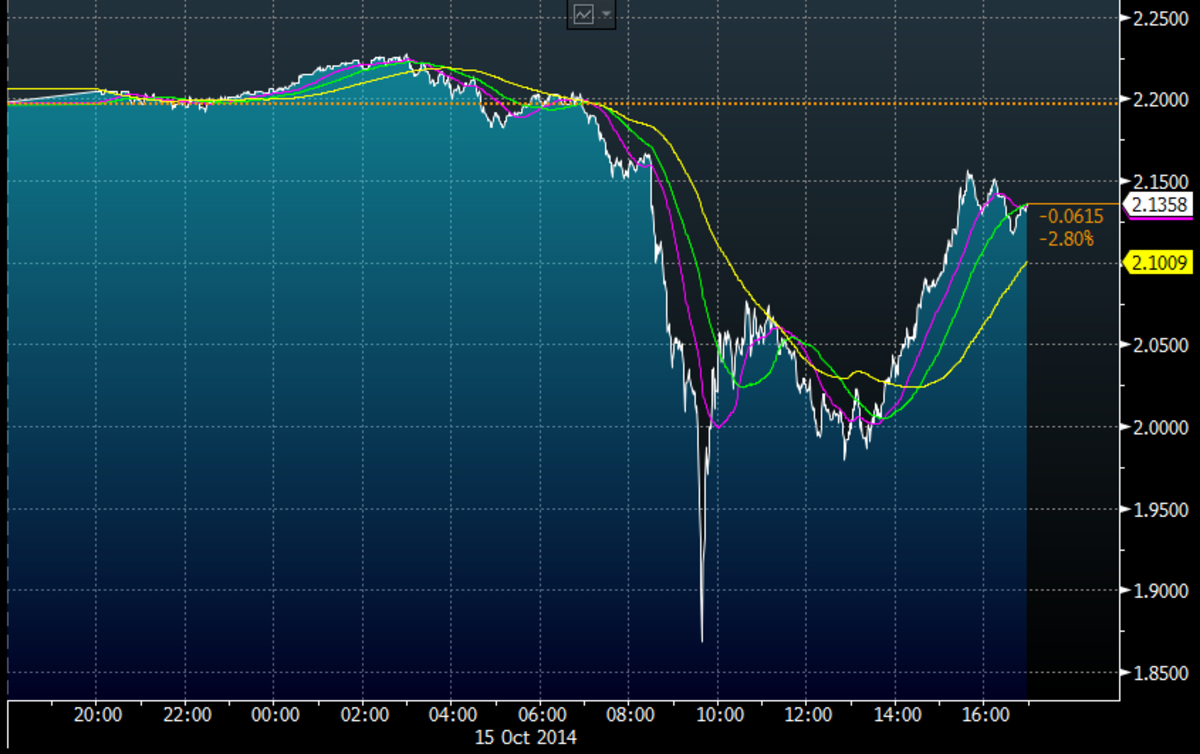
Bond traders are worried about a repeat of October, 15

View image on Twitter
Bond traders are worried about a repeat of October, 15 http://www.bloomberg.com/news/articles/2015-03-30/bond-traders-fear-oct-15-style-volatility-could-repeat  via @boes_
 
(Bloomberg) — A group of U.S. Treasury market professionals sponsored by the Federal Reserve Bank of New York expressed concern that the large gyrations seen in that market on Oct. 15 could be repeated in the future, according to minutes of their meeting released Monday.
“Members generally suggested that, given the structural changes in the market, including growth of automated trading and impact of regulations, there is an increased potential for further episodes of volatility and impaired liquidity in Treasury markets,” minutes of the Treasury Market Practices Group’s Feb. 26 meeting showed.
http://www.bloomberg.com/news/articles/2015-03-30/bond-traders-fear-oct-15-style-volatility-could-repeat


“Until you start..putting some CEOs in jail, you’re not addressing the..issues.”

Jail CEOs
The new codes aren’t enough to contain misbehavior in the world’s largest financial market, according to James Rickards, chief global strategist at West Shore Funds and author of “Currency Wars: The Making of the Next Global Crisis.”
“This is a form of self regulation, but where’s the enforcement?” said Rickards. “It’s probably the best they can do. But in my view, all the codes and all the monitoring in the world will not substitute for a culture of compliance. Until you start actually arresting people, putting some CEOs in jail, you’re not addressing the cultural issues that are at the heart of this.”
The foreign-exchange market is one of the least regulated, opening the door to the risk of malpractice. Traders shared confidential information about their clients orders, and colluded to manipulate benchmark rates, according to the findings of regulators that were published in November.
The U.K. Financial Conduct Authority fined five banks 1.1 billion pounds ($1.6 billion), and said it would require about 30 more to overhaul their currency trading.

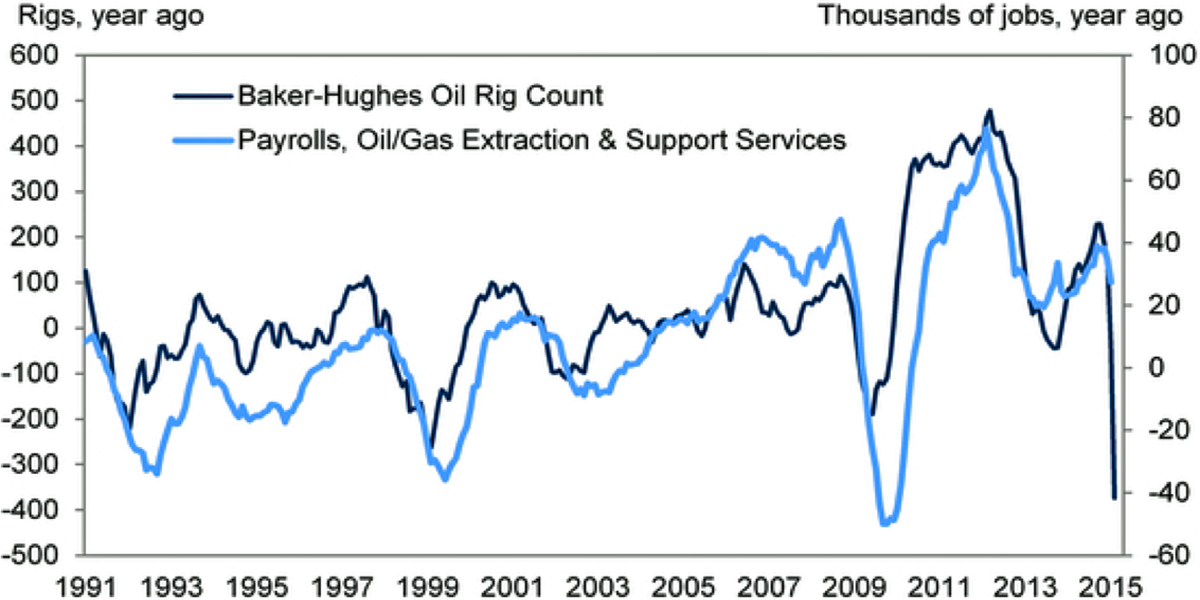
Energy payrolls have only started to fall (via Goldman’s Phillips)

Embedded image permalink