Wednesday, December 24, 2014

Bee Venom --- Alpha Lipid

Intensive Anti-Aging Moisturising Cream


Aging is not so scary anymore
Benefits:
  • Bee Venom Intensive Anti-Aging Moisturising Cream is a multifunctional cosmetic which kickstarts the body’s own production of Collagen and Elastin – the key factors to restoring younger, healthier, skin by decreasing the appearance of lines and wrinkles. It works in harmony with the body’s systems and is non-invasive or painful like surgery, skin peels, or injections.
  • Alpha Lipid Bee Venom Intensive Moisturising Cream is the only skin care product containing New Zealand’s Alpha Lipid Colostrum which provides TGF (Transforming Growth Factors) to promote skin cell repair and renewal.
Key active ingredients:
  • Bee Venom
  • Natural exotic oils such as jojoba, almond, macadamia seed
  • Manuka Honey
  • Evening Primrose
  • Shea Butter
How does New Image extract the Bee Venom?
The bee venom is ingeniously extracted when the bee lands on a glass pane which has a light electrical current running through it. The bee reacts by stinging the glass and leaves the venom behind to be collected, without the bee dying.
How to use:
This product is suitable for use by all men and women except those allergic to bee stings. We recommend to test on a small area of skin before first use and wait 20 minutes. If there are no adverse effects then continue applying to your face. Everyone’s skin is unique so you might experience a slight tingling sensation which is normal. You can also use this product as a Night Cream. Apply a generous layer over the face and neck and leave on overnight. In the morning use it again as a Day Cream. For best results apply twice daily and use within 12 months after opening.
50g/ 1.76oz

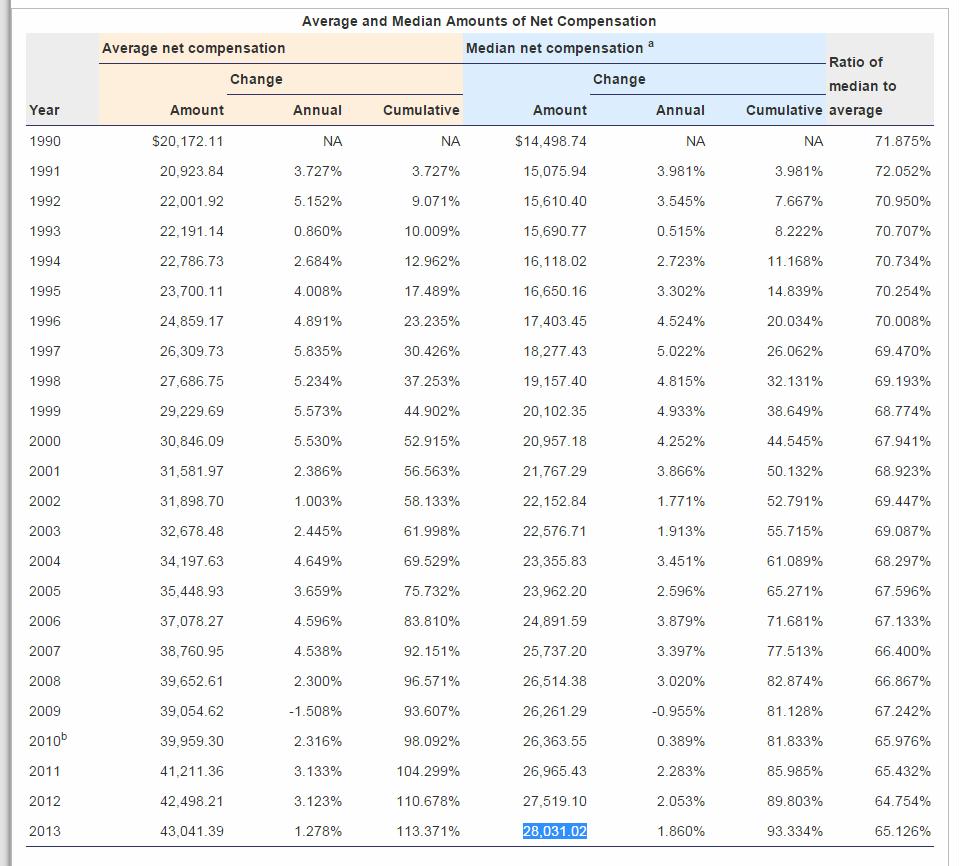
93% of American Wage Earners make less than $100k according to the SSA and 50% of them earned below $28,031.02

The national average wage index (AWI) is based on compensation (wages, tips, and the like) subject to Federal income taxes, as reported by employers on Forms W-2. Beginning with the AWI for 1991, compensation includes contributions to deferred compensation plans, but excludes certain distributions from plans where the distributions are included in the reported compensation subject to income taxes. We call the result of including contributions, and excluding certain distributions, net compensation. The table below summarizes the components of net compensation for 2013.
70,000.00 — 74,999.99 2,968,987 134,057,680 86.06000 215,031,183,359.11 72,425.77
75,000.00 — 79,999.99 2,559,327 136,617,007 87.70299 198,162,943,189.00 77,427.75
80,000.00 — 84,999.99 2,179,245 138,796,252 89.10199 179,639,334,066.10 82,431.91
85,000.00 — 89,999.99 1,873,165 140,669,417 90.30449 163,773,160,357.76 87,431.25
90,000.00 — 94,999.99 1,617,254 142,286,671 91.34271 149,463,631,096.84 92,418.16
95,000.00 — 99,999.99 1,402,053 143,688,724 92.24277 136,614,877,209.07 97,439.17
100,000.00 — 104,999.99 1,229,162 144,917,886 93.03185 125,888,071,678.53 102,417.80
http://www.ssa.gov/cgi-bin/netcomp.cgi?year=2013

View image on Twitter
Social Security Administration: "half of the workers earned below this level": $28,031.02. http://www.ssa.gov/oact/cola/central.html 

The Endless $1.6 Trillion War on Terror


By ,
The Fiscal TimesDecember 23, 2014
The U.S. is increasingly coming to grips with the terrible costs of the post-9/11 war on terror that has gone on for over a decade – with no end in sight.American casualties in Afghanistan and Iraq total 6,845 men and women, according to the latest official tally, while more than a million troops were wounded in both wars. The Senate Intelligence Committee recently released a startling 528-page document that chronicled the CIA’s often brutal and secretive tactics in interrogating terrorism suspects that for many ran counter to American values.Related: The New U.S. Price Tag for the War Against ISIS: $40 Billion a Year  Now the Congressional Research Service (CRS) has provided a new accounting of the cost of wars in the Middle East between 2001 and 2014 – interventions that have been more expensive than the Korean War, the Vietnam War and the Persian Gulf War of 1990-1991 all rolled into one – and adjusted for inflation.     The government has spent $1.6 trillion on warfare since the Sept. 11, 2001 attacks on New York and Washington – a staggering sum that works out to about $337 million a day every day for the past 13 years. By contrast, the U.S. spent $341 billion of inflation-adjusted dollars waging war on North Korea between 1950 and 1953, $38 billion on the Vietnam War between 1965 and 1975, and $102 billion on the first Persian Gulf War.  This new total is about half a trillion dollars more than when the CRS last tried estimating the overall cost in 2010. The entire tab for Operation Enduring Freedom in Afghanistan, Operation Iraqi Freedom and related military action was placed on the government’s credit card. In other words, the money going to the war through a special “Overseas Contingency Account” was added directly to the federal debt.  “All of these figures do not take into account the long-term consequences, in terms of post-traumatic stress disorder or long-term veterans’ bills,” said Gordon Adams, a professor of international relations and military history at American University. “The costs go on. Iraq and Afghanistan will end up being the gift that keeps on giving because – as we did with Vietnam – we will be living with the consequences for many, many years.”Related: Can the U.S. Defeat ISIS Without a War Powers Deal? The $1.1 trillion omnibus spending package passed by Congress and signed by President Obama sets aside $554 billion for defense spending through next Sept. 30, including $490 billion for running the Pentagon and buying weapons and $64 billion for the war effort. That total represents an $18 billion decrease from fiscal 2014 spending, according to the Military Times, reflecting Obama’s drawdown of troops from Afghanistan as he tries – not always successfully – to wind down that episode of the war on terrorism. The new CRS report found that slightly more than half the $1.6 trillion in total spending went to military operations in Iraq, where allied forces toppled Saddam Hussein’s regime and then waged war for years in a desperate effort to prop up a new government. An additional $686 billion was spent on U.S. military operations in Afghanistan, which began with U.S. forces seeking to hunt down Osama bin Laden and others behind the 9/11 attacks. The wars seem to go on forever – though overall U.S. troop levels in Afghanistan and Iraq began to decline at the tail end of President George W. Bush’s second term and early on in the Obama administration. Over time, annual war costs declined from a peak of $195 billion in FY2008 to $95 billion enacted in FY2014, the CRS saidUnder the latest timetable outlined by Obama last May, the 32,000 American troops now in Afghanistan will drop to 9,800 after this year. That number would then be cut in half by the end of 2015. If all goes as planned, there would be only a small residual force to protect the embassy in Kabul by the end of 2016. At the height of American involvement, in 2011, the U.S. had 101,000 troops there.Related: McCain Moves Center Stage on War and Foreign Policy   The withdrawal of U.S. military forces from Iraq began in December 2007 with the end of the so-called troop surge. It was completed by December 2011, which technically brought an end to the Iraq War. The number of U.S. military forces in Iraq peaked at 170,300 in November 2007. Yet with security conditions deteriorating, U.S. forces returned last summer under a new Iraq Status of Force agreement.With al-Qaeda and the Taliban still a deadly force in Afghanistan and ISIS claiming vast swaths of Iraq and Syria, the Obama administration and Congress are bracing for what may be a much longer engagement in the Middle East. “It’s like we cannot get out of there,” said Adams, the military expert. “The entire Afghan army and police force rely on U.S. and other international dollars for their salaries. And the Iraqis are going to rely on us for aerial bombardments to deal with the ISIS crisis.” Adams added, “This long-term crisis is in part a direct outgrowth of the U.S.’s decision particularly to take down Saddam Hussein. We’re going to live with that for God knows how many years because it created an instability in the heart of the region that is now spilling over everywhere.” Related: The War Against ISIS Will Explode Our Nation’s Debt    Last week, a Pentagon official said that since August, the government has spent more than $1 billion on airstrikes against ISIS in Iraq and parts of Syria. The administration also said it was deploying another 1,300 troops to Iraq as advisers, bringing to 3,000 the total number of U.S. advisory troops in Iraq. Obama has vowed not to send in ground troops to try to weed out or destroy ISIS, but Sen. John McCain (R-AZ) and many other leading Republicans say it will be impossible to defeat ISIS with airstrikes alone. Top Reads from The Fiscal Times:Obama Takes a Largely Unearned Victory Lap on RussiaCuba by the Numbers: What You Need to Know Obama Wants Long-Term Infrastructure Plan, Not Keystone
- See more at: http://www.thefiscaltimes.com/2014/12/23/Endless-16-Trillion-War-Terror#sthash.YLcjmVjR.dpuf

Russia Busts “Gold-Selling” Rumors, Reports It Bought Another 600,000 Ounces Taking Gold Holdings To New Record High

Tyler Durden: Yesterday, when we reported the latest rumor of Russian gold selling, this time out of SocGen, we said that “it should be noted that SocGen and its “sources” have a conflict: in an indirect way, none other than SocGen is suddenly very interested in Russia stabilizing its economy because as we wrote before, ”Russia Contagion Spreads To European Banks : French SocGen, Austrian Raiffeisen Plummet” which also sent SocGen’s default risk higher in recent days.
So if all it will take to stabilize the RUB sell off, reduce fears of Russian contagion, and halt the selloff of SocGen stocks is a “source” reporting what may or may not be the case, so be it.”
Moments ago, as if to deter further speculation that Russia is indeed converting hard money earned from real resources for fiat paper, the Russian monetary authority made it quite clear, that at least in November, Russia not only did not sell any gold, but in fact bought another 600K ounces in the month of November.

  • RUSSIAN MONETARY GOLD HOLDINGS RISE VS 37.6M ON NOV. 1
  • RUSSIAN MONETARY GOLD HOLDINGS 38.2M TROY OZ AS OF DEC. 1
So we can now add another 600K to Russia’s most recent holdings:

Which of course means that the very “Russia is selling” rumors that were so effectively used to keep the price of gold low into the recent risk-flaring episode, were capitalized on by the very same Russia, which we do however know sold some $8 billion in US Treasurys in October bringing its total holdings of US paper to the second lowest since 2008.

Pages: Next

The Savings and Loan Banking Crisis: George Bush, the CIA, and Organized Crime


http://thefilmarchive.org/
1992
The savings and loan crisis of the 1980s and 1990s (commonly dubbed the S&L crisis) was the failure of about 747 out of the 3,234 savings and loan associations in the United States. A savings and loan or “thrift” is a financial institution that accepts savings deposits and makes mortgage, car and other personal loans to individual members—a cooperative venture known in the United Kingdom as a Building Society. “As of December 31, 1995, RTC estimated that the total cost for resolving the 747 failed institutions was $87.9 billion.” The remainder of the bailout was paid for by charges on savings and loan accounts — which contributed to the large budget deficits of the early 1990s.
The concomitant slowdown in the finance industry and the real estate market may have been a contributing cause of the 1990–91 economic recession. Between 1986 and 1991, the number of new homes constructed per year dropped from 1.8 million to 1 million, which was at the time the lowest rate since World War II.
The United States Congress granted all thrifts in 1980, including savings and loan associations, the power to make consumer and commercial loans and to issue transaction accounts. Designed to help the thrift industry retain its deposit base and to improve its profitability, the Depository Institutions Deregulation and Monetary Control Act (DIDMCA) of 1980 allowed thrifts to make consumer loans up to 20 percent of their assets, issue credit cards, accept negotiable order of withdrawal (NOW) accounts from individuals and nonprofit organizations, and invest up to 20 percent of their assets in commercial real estate loans.
The damage to S&L operations led Congress to act, passing the Economic Recovery Tax Act of 1981 (ERTA) in August 1981 and initiating the regulatory changes by the Federal Home Loan Bank Board allowing S&Ls to sell their mortgage loans and use the cash generated to seek better returns soon after enactment; the losses created by the sales were to be amortized over the life of the loan, and any losses could also be offset against taxes paid over the preceding 10 years. This all made S&Ls eager to sell their loans. The buyers—major Wall Street firms—were quick to take advantage of the S&Ls’ lack of expertise, buying at 60%-90% of value and then transforming the loans by bundling them as, effectively, government-backed bonds (by virtue of Ginnie Mae, Freddie Mac, or Fannie Mae guarantees). S&Ls were one group buying these bonds, holding $150 billion by 1986, and being charged substantial fees for the transactions.
In 1982, the Garn-St Germain Depository Institutions Act was passed and increased the proportion of assets that thrifts could hold in consumer and commercial real estate loans and allowed thrifts to invest 5 percent of their assets in commercial loans until January 1, 1984, when this percentage increased to 10 percent.
A large number of S&L customers’ defaults and bankruptcies ensued, and the S&Ls that had overextended themselves were forced into insolvency proceedings themselves.
The Federal Savings and Loan Insurance Corporation (FSLIC), a federal government agency that insured S&L accounts in the same way the Federal Deposit Insurance Corporation insures commercial bank accounts, then had to repay all the depositors whose money was lost. From 1986 to 1989, FSLIC closed or otherwise resolved 296 institutions with total assets of $125 billion. An even more traumatic period followed, with the creation of the Resolution Trust Corporation in 1989 and that agency’s resolution by mid-1995 of an additional 747 thrifts.
A Federal Reserve Bank panel stated the resulting taxpayer bailout ended up being even larger than it would have been because moral hazard and adverse selection incentives that compounded the system’s losses.
There also were state-chartered S&Ls that failed. Some state insurance funds failed, requiring state taxpayer bailouts.
http://en.wikipedia.org/wiki/Savings_…

Don Durrett: The Precious Metals Market Is Set To Rebound In 2015


Wall St for Main St interviewed Don Durrett, who is the editor of Goldsilverdata.com. In this podcast, we discussed the dismal year for gold and silver and why the prices went down despite strong demand globally. Also, we talked about the lack of mergers and acquisitions in the sector and the reasoning behind it. Plus, we talked about our outlook for the economy and the precious metals market in 2015.
Please visit the Wall St for Main St website here http://www.wallstformainst.com/
Follow Jason Burack on Twitter @JasonEBurack
Follow Mo Dawoud on Twitter @m0dawoud
Follow John Manfreda on Twitter @JohnManfreda
Follow Wall St for Main St on Twitter @WallStforMainSt
Also, please take 5 minutes to leave us a good iTunes review here!https://itunes.apple.com/us/podcast/w…
If you feel like donating fiat, Bitcoin, gold or silver, Wall St for Main St accepts donations on our main website.
Wall St for Main St is also available for personalized investor education and consulting! Please email us to learn more about it!

Currency wars… are we there yet?


Russia Has Begun Selling Its Gold, According To SocGen
A few days ago, we first reported a rumor that was floating around Wall Street desks, and which, according to some, was the “reason” that gold was being kept lower even as sovereign risk was exploding around the globe. The rumor was that Russia was selling its gold holdings:
http://www.zerohedge.com/news/2014-12-18/russia-has-begun-selling-its-gold-according-socgen


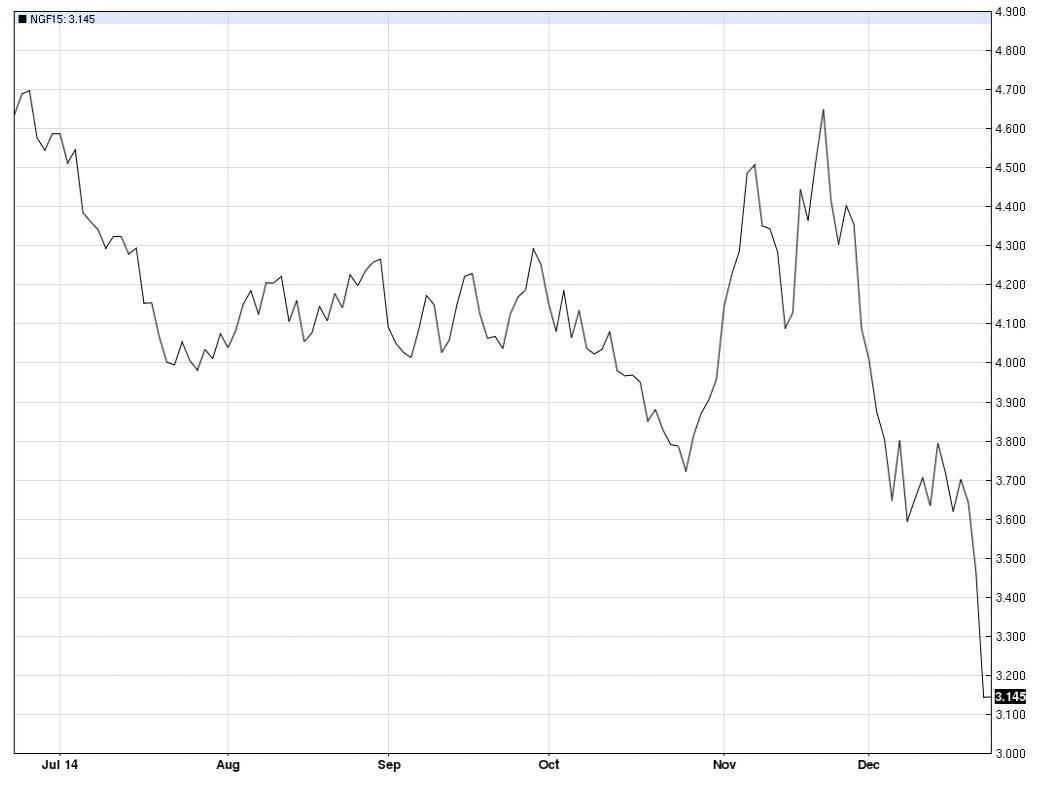
Chart: January-2015 US natural gas futures contract

View image on Twitter
Chart: January-2015 US natural gas futures contract -

Cyprus Bank Runs (Tip of the Pyramid)


Kazakhstan Prepares For $40 Oil, Gary Schilling Says "Oil Going To $20"


"People should not be worried," explained Kazakhstan President Nursultan Nazarbayev in a TV address over the weekend, "we have a plan in place if oil prices are $40 per barrel." Kazakhstan, the second largest ex-Soviet oil producer after Russia, explains "there are reserves which could support people, preventing living conditions from worsening." However, if A. Gary Schilling's reality check of $20 oil being possible comes to fruition, as he explains, what matters are marginal costs - the expense of retrieving oil once the holes have been drilled and pipelines laid. That number is more like $10 to $20 a barrel in the Persian Gulf... We wonder who has a plan for that?

The Kazakh President says "don't worry", as Reuters reports...
Kazakhstan, the second largest ex-Soviet oil producer after Russia, has plans in place should global oil prices fall as low as $40 per barrel, President Nursultan Nazarbayev told local TV channels.

"Kazakh people should not be worried. We have a plan if oil price are $70, $60, $50, $40 per barrel," he said, according to a transcript published on his website www.akorda.kz.

"There are reserves which could support people, preventing living conditions from worsening," he said, without providing any details.

Kazakhstan's National Fund, which collects oil revenues, stood at $76.8 billion at the end of November. Separately, the central bank's net gold and foreign exchange reserves stood at $27.9 billion.

Nazarbayev has also urged the Kazakh people not to worry about the slide in Russia's rouble currency, which has lost some 45 percent of its value versus the dollar this year.
But A Gary Schilling is less sure... (via Bloomberg View)
When the U.S. Federal Reserve ended its quantitative-easing program in October, it also ended the primary driver of U.S. stocks during the past six years. So long as the central bank kept flooding the markets with money, investors had little reason to worry about a broader economy limping along at 2 percent real growth.

Now investors face more volatile markets and securities that no longer move in lock-step. At the same time, investors must cope with slower growth in China, minuscule growth in the euro area and negative growth in Japan.

Such widespread sluggish demand -- along with ample supplies of oil and most everything else -- is the reason commodity prices are falling. They have been since early 2011, but many people failed to notice until recently, when crude oil prices nosedived.

Normally, less demand and a supply glut would lead the Organization of Petroleum Exporting Countries, beginning with Saudi Arabia, to cut production. As the de facto cartel leader, the Saudis would often reduce output to prevent supply increases from driving down prices.

Of course, this also cost the Saudis market share and encouraged cheating by OPEC members. Saudi leaders must grind their teeth over the last decade's unchanged demand for OPEC oil, while all the global growth has been among non-OPEC suppliers, principally in North America.

That may explain why, while Americans were enjoying their Thanksgiving turkeys, OPEC surprised the world. Pressed by the Saudis and other rich Persian Gulf producers, it refused to cut output despite a 38 percent drop in the price of Brent crude, the global benchmark, since June.

OPEC, in effect, is challenging other producers to a game of chicken. Sure, the wealthier producers need almost $100 a barrel to finance bloated budgets. But they also have huge cash reserves, which they figure will outlast the cheaters and the U.S. shale-oil producers when prices are low.

The Saudis also seized the opportunity to damage their opponents, especially Iran and what they see as Iran-dominated Iraq, in the Syria conflict. They also want to help allies Egypt and Pakistan reduce expensive energy subsidies as prices fall.

Then there’s Russia, another Saudi opponent in Syria, with its dependence on oil exports to finance imports and 42 percent of government outlays. With the ruble collapsing, the Russian central bank let the currency float in November after blowing through $75 billion to support it. Then the central bank tried to stop the free fall by raising interest rates by 6.5 percentage points to 17 percent on Dec. 15.

Still, the Russian currency is floundering, along with the economy. Consumer prices in Russia rose 9.1 percent in November from a year earlier. The economy will be in recession next year, the website of the Russian economy ministry acknowledged for a few hours on Dec. 2, before the posting was deleted.

Venezuela is also suffering. The government needs $125-a-barrel oil to cover its spending, of which 65 percent depends on oil exports. Its crude production is down a third since 2000. With inflation raging, the bolivar officially sells for 6.29 a dollar, but for 180 on the black market.

In Nigeria, where oil and natural gas account for 80 percent of government revenue and almost all its exports, the naira has fallen 11 percent versus the greenback so far this year.

How low can oil prices go? In the current price war, the global market price needed to support government budgets isn't really the main issue. Nor are the total costs for exploration, drilling and transportation.

What matters are marginal costs -- the expense of retrieving oil once the holes have been drilled and pipelines laid. That number is more like $10 to $20 a barrel in the Persian Gulf, and about the same for U.S. shale-oil producers. The estimated $50 to $69 a barrel break-even point for most new U.S. shale-oil production is less relevant. 

Developing countries that depend on commodity exports for hard currencies to service foreign debt will produce and export even at prices below their marginal cost. Until some major producer chickens out and cuts production, oil prices should remain low. They could decline a lot more than the 50 percent drop so far.

U.S. Recovery Isn’t as Robust as Data Suggests: Michele

Dec. 23 (Bloomberg) — JPMorgan Asset Management Global CIO of Fixed Income Robert Michele and Jones Day Global Head of Mergers and Acquisitions Robert Profusek discuss the Fed normalizing rates and the outlook for the U.S. markets on “Bloomberg Surveillance.” (Source: Bloomberg)
Read more at http://investmentwatchblog.com/u-s-recovery-isnt-as-robust-as-data-suggests-michele/#CrOxAJUjvkdtQsSS.99

Nobel Laureate Sees No recession In U.S. – Forbes, Aug. 31, 2007


$20 oil wouldn’t force production cut – Saudi oil minister

$20 oil wouldn’t force production cut – Saudi oil minister

Published time: December 23, 2014 11:16
Edited time: December 23, 2014 16:02
Saudi Arabia's Oil Minister Ali al-Naimi. (Reuters/Heinz-Peter Bader)
3.8K510
Saudi Arabia’s oil minister said OPEC wouldn't budge on its decision not cut production, even if oil hits $20 a barrel. He also said the world may never see $100 a barrel ever again.
“It is not in the interest of OPEC producers to cut their production, whatever the price is,” Ali al-Naimi told the Middle East Economic Survey, a weekly oil and gas publication. Naimi added, “Whether it goes down to $20, $40, $50, $60, it is irrelevant.”
Saudi Arabia is the world’s largest oil producer, and is also the most dominant force in the Organization of the Petroleum Exporting Countries (OPEC).
“We have entered a scary time for the oil market and for the next several years we are going to be dealing with a lot of volatility,” Naimi said. “Just about everything will be touched by this.”

Other Arab OPEC producers expect global oil prices to recover to the tune of $70-80 per barrel by the end of 2015, spurred by economic recovery, Reuters reported, citing unmade OPEC delegates. Some of them described as hailing from core Gulf producing nations even see $100 as a real possibility.
Oil prices have been sinking steadily since the peak of $115 in June, losing nearly 50 percent, standing at $60.25 a barrel at the time of publication.
Lower oil prices will hurt oil companies, as investors will shy away from putting money into pricey exploration and drilling projects. Overall, oil producers stand to lose more than $1 trillion if oil prices remain at $60 per barrel, according to a report by Goldman Sachs.
The slump also puts hundreds of thousands of oil and gas industry workers around the world at risk of losing their jobs. The UK alone could lose 35,000 jobs should the industry collapse.
READ MORE: 35,000 oil & gas jobs at risk as crude price tumbles – study
Conversely, an IMF economist has come out and said that low oil could boost world growth by between 0.3 and 0.8 percent.
Prices took a sharp downward turn in November, after the OPEC oil cartel decided not to cut production from 30 million barrels per day. Combined, the 12 OPEC nations produce 40 percent of the world’s oil. The group meets again in June to discuss production levels.
The group lowered production to boost oil prices following the 2008 financial crisis.

AFP Photo/Str
AFP Photo/Str
Many analysts believe that influential Saudi Arabia was behind the decision to keep prices low, in order to squeeze out other competitors, namely American shale oil, which has completely changed the energy market in the past 5 years.
The majority of OPEC members are now selling oil at a loss.
Low oil prices are bad news for exporters, especially those who cannot produce oil cheaply. OPEC members Venezuela and Nigeria especially would feel the pinch of $20 per barrel, with many analysts believing it could lead Venezuela to default.
READ MORE: Fitch slashes Venezuela rating to pre-default level
Countries highly dependent on imports, such as Japan, China, India, Turkey, and Europe, will benefit from the discount.
However, it is bad for exporters, especially Russia, which has forecast GDP will fall 4.7 percent next year if oil prices stay at $60.
On the flip side, it’s good for customers. In the US petrol pump prices have already dropped by $1 gallon since the decision was taken by OPEC.

World Trade Faltering pre-Christmas? Steepest decline in post-Thanksgiving Baltic Dry Index EVER (recorded history).

Baltic Dry Index down 63% for the year!! It is down to 845!
http://www.bloomberg.com/quote/BDIY:IND
We are sure it’s nothing – since stock markets in China and The US are soaring – but deep, deep down in the heart of the real economies, there is a problem. The Baltic Dry Index has fallen for 21 straight days, tumbling around 40% since Thanksgiving Day.  


http://www.shtfplan.com/headline-news/chart-points-to-massive-slow-down-this-is-the-biggest-collapse-in-the-trade-indicator-since-records-began_12202014
Chart Points To Massive Slow Down: “This Is The Biggest Collapse In The ‘Trade’ Indicator Since Records Began”
http://www.shtfplan.com/headline-news/chart-points-to-massive-slow-down-this-is-the-biggest-collapse-in-the-trade-indicator-since-records-began_12202014

Durable Goods Orders in U.S. Unexpectedly Fell 0.7% in November

Orders for U.S. durable goods unexpectedly declined in November as corporate investment stagnated and demand weakened for military equipment.
Bookings for goods meant to last at least three years decreased 0.7 percent, the third decline in four months, a Commerce Department report showed today in Washington. The median forecast of 77 economists surveyed by Bloomberg called for a 3 percent gain after a 0.3 percent increase in October. Excluding defense, orders dropped for a fourth month.
Business demand for computers, metals and electrical equipment declined or was little changed last month as the global economy cools. Orders for motor vehicles increased, underscoring a pickup in household spending that helped spur the economy in the third quarter.
Revised figures today showed the economy grew at a 5 percent annualized rate in the three months through September, the biggest gain in 11 years, compared with a prior estimate of 3.9 percent.
Defense-related capital goods bookings dropped 8.1 percent in November after a 10 percent gain the prior month.
Demand for non-military capital goods excluding aircraft was unchanged after a 1.9 percent decrease in October.
Shipments of non-military capital goods excluding aircraft, used in calculating gross domestic product, rose 0.2 percent in November after declining 0.9 percent.
Orders for commercial aircraft climbed 0.6 percent in November. Chicago-based Boeing Co. said it received 224 orders for planes last month, the most since July.
Excluding transportation equipment, which is often volatile from month to month, bookings fell 0.4 percent, today’s data showed.

Understanding the Aggressive US Stance Towards Russia

While Russia is of course guilty of crimes, the US is guilty of the same and far worse crimes, and is fervently supporting many other criminal groups and states.  Thus, to understand why US extremists (not the US public) in control of the state are putting us all in serious potential danger by choosing to target nuclear Russia, we have to look back, and, of course, beyond the narrative peddled by the aggressors themselves.

In 1918, US oligarchs and religious extremist Woodrow Wilson sent about 13,000 young American men to join tens of thousands of others from a Western-dominated axis and illegally invade Russia with intent to commit premeditated mass murder.
“Two years and thousands of casualties [including ~400 US] later,” Blum notes, “the American troops left, having failed in their mission to ‘strangle at its birth’ the Bolshevik state, as Winston Churchill put it.”  Churchill further admitted that the Western axis forces were “invaders” who shot Russians on sight, blockaded their ports, sank their ships, and armed their enemies.
The British in Russia in 1918 committed what at the time was considered the ultimate conceivable atrocity: they killed people with chemical weapons – poison gas – as Churchill suggested the British Empire should also do against Iraqi civilians, in the hope of spreading what he called “a lively terror”.
The 1917 Bolshevik Revolution, Chomsky, Gaddis (Professor of military and naval history, Yale), and other historians find, was the real beginning of the US “cold” war against Russia, which has continued essentially without break and is today being spiked by US strongman Barack Obama and his cadre.
Gaddis says the 1917 Western aggressive invasion of Russia was perpetrated to ensure the “survival of the capitalist order” in the face of what was called a “communist threat”.  Chomsky notes that by this logic, since the US threatens to – and does – globally enforce what is called “capitalism” (the “capitalist threat”), then anyone who wants to ensure the survival of a different order would likewise “be entirely justified in carrying out a defensive invasion of the US”, and using chemical weapons, or, “if they don’t have the power for that”, committing one-off attacks like “blowing up the World Trade Center” (Chomsky of course says this to expose the hypocritical aggressor’s logic).
By “capitalist order”, Gaddis refers to Western oligarchic top down dominance of society, the system that, while ~100 million deaths occurred worldwide under so-called “communism”, ~100 million deaths simultaneously occurred under so-called “capitalist” India alone.  As experts put it, while China was bringing some six hundred million people out of poverty (U.N. stat), an achievement unparalleled in history, “every eight years, India put as many skeletons in its closet” as China did during its years of famine.  When the number of people killed under what is called “capitalism” is extended beyond India to the rest of the world, Chomsky notes, “it would be colossal.”  In the West, he continues, only the “communist” death numbers can be mentioned.  As for the number of “capitalist” deaths, one “wouldn’t talk about them”.
The “colossal” death figures flowing from their system being of no concern and, perhaps, some satisfaction to oligarchs*, and their ever-increasing personal enrichment at the expense of others being of chief import, their “order” had to be preserved, their brutal march of expansion forced onward.  Hence, the insolent 1917 Russian notion of a modification to the oligarchic order in which Russians were on the bottom had to be, as Churchill noted, snuffed out immediately.  The threat of an internal change in Russia, Chomsky notes, referring to a 1955 US study, was that places like Russia and Eastern Europe generally, the components of the original “third world”, which had long been made to provide cheap labor and resources for the Western oligarchy, were reducing their “willingness” to “complement the industrial economies of the West, which is the job of the Third World.”  That, Chomsky says, agreeing with Gaddis and others, was the actual “threat of communism” that was immediately understood and acted on by Western oligarchs in 1917.
Indeed, as racial supremacist Woodrow Wilson, who spokes-headed the US in 1918 when it invaded Russia, secretly noted:
“Since trade ignores national boundaries and the manufacturer insists on having the world as a market, the flag of his nation must follow him, and the doors of the nations which are closed against him must be battered down. Concessions obtained by financiers must be safeguarded by ministers of state, even if the sovereignty of unwilling nations be outraged in the process. Colonies must be obtained or planted, in order that no useful corner of the world may be overlooked or left unused.”
Wilson’s imagery of using armed men to batter in closed doors and physically force the “unwilling” to submit to the desires of “manufacturers” and “financiers” sheds light on the words of Indian writer Arundhati Roy, who said “Those of us who belong to former colonies think of imperialism as rape.”
But the unwilling people of the Soviet Union, despite being raped “in [the] cradle” by Western oligarchs, had “managed to survive to adulthood.”  Thus, they had to be raped again by the West, “by the Nazi war machine with the blessings of the Western powers” (Blum).  This time, as many as 40 million Russians, amounting to perhaps a third of the Russian population, were exterminated.

In 1991, even when the Soviet Union, sufficiently battered and now the Russian Federation, finally “reopened” to Western-style oligarchic plunder, the West was still unsatisfied.  While maintaining in Latin America and elsewhere the terror regimes that Chomsky points out are overwhelmingly documented in scholarship to have been worse than the satellites maintained by the Soviets, insatiable US controllers now began penetrating east through Europe with their “NATO” military installations, which they had dishonestly claimed only existed to counterbalance the Soviet Union.  When Russian leaders pointed out that NATO expansion was in violation of specific US promises not to move NATO “one inch east”, US reps essentially replied that if anyone is stupid enough to expect them to honor their word, that is their problem – a point impossible to contest.
Currently, US oligarchs are using siege tactics to intentionally target all 143 million Russian civilians in attempt to expand their “order” of top-down control, exploitation, and mass death over Russian resources and labor.  In addition to this aim, perhaps these US extremists will succeed in bringing capital punishment back to Russia, will be able to vastly expand the Russian prison system to mirror the highly profitable one of the US, revoke paid maternity leave, revoke Russia’s ratification of the UN declaration on the rights of children, and make other changes US oligarchic media outlets insist are attributes of “freedom” and other keywords.

A pension benefit used to seem as good as money in the bank—but now most plans are falling short

Retirement security is ending the year at an all-time low. The $1.1 trillion last-minute spending bill will allow trustees to cut benefits in multiemployer defined benefit pension plans. And while it affects a relatively small population, 10 million people at most, it opens the door for other employers to make similar cuts. Maybe that’s a long way off; maybe not. But the provision is a rude awakening: We may romanticize guaranteed retirement benefits and lament our 401(k) world, but pensions aren’t safe these days either.
Until recently, a pension benefit seemed as good as money in the bank. Companies or governments set aside money for employees’ retirements; the sponsors were on the hook for funding the promised benefits appropriately. In recent years, it has become clear that most pension plans are falling short, but accrued benefits normally aren’t cut unless the plan, or employer, is on the verge of bankruptcy—high-profile examples include airline and steel companies. Public pension benefits appear even safer, because they are guaranteed by state constitutions.
By comparison, 401(k) and other defined contribution plans seem much less reliable. They require employees to decide, individually, to set aside money for retirement and to invest it appropriately over the course of 30 or so years. Research suggests that people are remarkably bad at both: About 20 percent of eligible employees don’t participate in their 401(k) plan. Those who do save too little, and many choose investments that underperform the market, charge high investment fees, or both.
MORE:
http://www.businessweek.com/articles/2014-12-22/the-real-risk-of-pension-plans-they-give-retirees-false-security
America’s Greece?
Illinois risks default if it fails to tackle its public-pension crisis
http://www.economist.com/news/united-states/21636786-illinois-risks-default-if-it-fails-tackle-its-public-pension-crisis-americas-greece
Your Money Is NOT Safe In The Bank Or Your Pension – Dick Morris TV: Lunch Alert!
http://www.dickmorris.com/money-safe-bank-pension-dick-morris-tv-lunch-alert/
America’s pension crisis

Pensions crisis
The pensions crisis is a predicted difficulty in paying for corporate, state, and federal pensions in the United States and Europe, due to a difference between pension obligations and the resources set aside to fund them. Shifting demographics are causing a lower ratio of workers per retiree; contributing factors include retirees living longer (increasing the relative number of retirees), and lower birth rates (decreasing the relative number of workers, especially relative to the Post-WW2 Baby Boom). There is significant debate regarding the magnitude and importance of the problem, as well as the solutions.[1]
For example, as of 2008, the estimates for the underfunding of U.S. states’ pension programs range from $1 trillion[2] using the discount rate of 8% to $3.23 trillion using U.S. Treasury bond yields as the discount rate.[3] The present value of unfunded obligations under Social Security as of August 2010 was approximately $5.4 trillion. In other words, this amount would have to be set aside today such that the principal and interest would cover the program’s shortfall between tax revenues and payouts over the next 75 years.[4]
Some economists question the concept of funding, and, therefore underfunding. Storing funds by governments, in the form of fiat currencies, is the functional equivalent of storing a collection of their own IOUs. They will be equally inflationary to newly written ones when they do come to be used.[5]
http://en.wikipedia.org/wiki/Pensions_crisis

Marc Faber: The U.S. Is The Laughing Stock Of The World, It Can’t Last Much Longer (Video)

All governments are corrupt, how much longer before the people rise up? The money manipulators are running the world. So “I have no idea what the world will look like in five years”
“At one point money printing and stocks rising will disconnect, this is a fact”.
The system as it is today will not last much longer and it will not be a pleasent change for most people. “The U.S. is in the dumps, the prestige of America is gone, their government is a laughing stock of the world”!

Like yesterday’s existing home sales report, today’s report on new home sales came in below low-end expectations

Highlights
Like yesterday’s existing home sales report, today’s report on new home sales came in below low-end expectations, down 1.6 percent in November to an annual sales rate of 438,000 vs expectations for 460,000 and Econoday’s low-end estimate for 440,000.
Also like yesterday’s existing home sales report, price data show weakness with the median price down 3.2 percent in the month to $280,000. Year-on-year, the median price is up only 1.4 percent which, in what at least doesn’t point to an imbalance, is largely in line with year-on-year sales which are down 1.6 percent.
Supply data are stable with 213,000 new homes on the market vs 210,000 in October. Supply relative to sales is up slightly, to 5.8 months from 5.7 and 5.5 months in the prior two months. Regional sales data show declines in 3 of 4 regions including the South, which is larger than all other regions combined in this report, and a gain in the West.
Housing had been showing some life going into the third quarter but the readings on November have been a surprising disappointment and won’t be good reading for the nation’s builders.
http://mam.econoday.com/byshoweventfull.asp?fid=461390&cust=mam&year=2014&lid=0&prev=/byweek.asp#top
The Housing Recovery Remains Cancelled Due To 6 Months Of Downward Revisions
Following last month’s surge to record high home prices, it is perhaps no surprise that for the6th month in a row, home prices have been revised lower. New Home Sales printed 438k, down from prior revised lower 445k and missing expectations of a surge to 460k…missing for 8 of the last 10 months. However, the key focus should be on the epic revisions of the (by now useless) home sales. For the period May – November, the initial new home sales prints amount to 2.779MM houses. Post revision, the number plunges by 22% to 2.168K. There goes the housing pillar of recovery (let’s hope economists are wrong and rates don’t rise next year eh?)

Spot the recovery…

http://www.zerohedge.com/news/2014-12-23/housing-recovery-remains-cancelled-due-6-months-downward-revisions
Another Hit To The ‘Escape Velocity’ Story——Rebound of Existing Home Sales Falters In November.
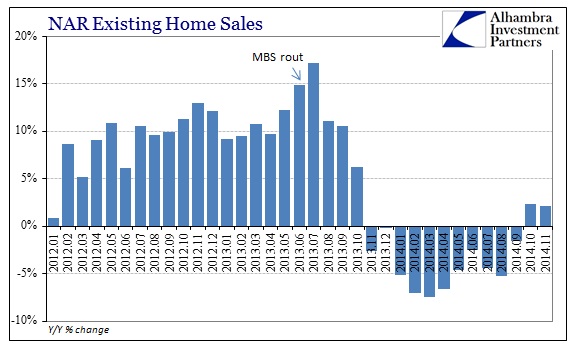
Adding to the disfavor in real estate and housing, the National Association of Realtor’s projection for existing home sales (resales) in November was just as ugly (if not more so) as home construction estimates. Resales were down a rather steep 6.5% from October (SAAR’s), and were up only 2.1% compared to November 2013. I say “only” because the calendar has wound into what should have been very favorable comparisons as the prior year period is well into last year’s epic decline. For November 2014 to be essentially flat with November 2013 is not a good sign.
ABOOK Dec 2014 NAR Mtgs Existing SAARABOOK Dec 2014 NAR Mtgs Existing YY
http://davidstockmanscontracorner.com/another-hit-to-the-escape-velocity-story-existing-home-sales-rebound-falters-in-november/

Wall Street surge another sign of instability

By Nick Beams
Instability in the global economy is not solely indicated by sharp falls in financial markets. Large swings and rapid rises can, at times, also point to mounting problems. The events of last week were one such occasion.
It began with the plunge of the Russian rouble under the impact of falling oil prices, down more than 40 percent since June, and of tightening economic sanctions which have cut off the access of Russian corporations to capital on global financial markets.
The turbulence surrounding Russia, which saw the central bank announce at midnight on Monday the lifting of its rate to 17 percent, sent tremors through the markets amid fears that there could be a repeat of the 1998 financial crisis, when Russia defaulted on its debts.
However, the rate hike of 6.5 percentage points failed to halt the plunge. On Tuesday, the deputy chief of the Russian central bank, Sergei Shvetsov, described the situation as “a nightmare that we could not even have imagined a year ago.”
Despite such concerns, the week ended with a three-day surge on Wall Street which took the Dow and the S&P 500 indexes close to their record highs. The Dow experienced a rise of more than 700 points, with a one-day rise on Thursday of more than 400 points.
The impetus for the turnaround came on Wednesday when the US Federal Reserve announced that it was not going to cut off the supply of ultra-cheap money to financial markets any time soon. The key phrase in the Fed’s statement was that it would be “patient in beginning to normalize the stance of monetary policy.”
Concerns had been expressed in financial circles that a change from the previous language that interest rates would remain between zero and 0.25 percent “for a considerable time” would signal a rapid tightening. Fed chair Janet Yellen was at pains to reassure the markets. The new language, she said, did not represent a change in policy intentions.
And so, like a drug addict being informed that his supplier would continue to meet his cravings, the markets celebrated.
But even amid the euphoria there were signs that all is far from well. TheNew York Times noted that a “major fear is that sluggishness in large overseas markets will eventual eat into confidence and corporate earnings.” Europe is the major centre of concern because economic output has not even returned to the level it reached before the eruption of the global financial crisis more than six years ago.
The article pointed out that yields on 10-year treasury bonds had risen, implying a worsening outlook for the American economy. It cited a hedge fund analyst who said that, while the most abundant commodity on Wall Street was optimism, “we appear to have gone off the road and the disconnect between stock prices and the real economy is being stretched.”
Notwithstanding the halt to the rouble’s plunge and a slight upturn in oil prices in recent days, Russian financial markets remain on a knife-edge with the rouble having lost half its value in the course of a year.
Companies that need dollars to roll over their debts are being denied access to international capital markets because of the sanctions imposed by the United States and the European Union. As a result they have dumped roubles on the market to try to meet their requirements, putting downward pressure on the currency. According to financial analysts, the downgrading of Russian debt to junk status is only a matter of time.
The mounting financial crisis in the Ukraine could be indicative of what is coming. Last week the country’s credit rating was further cut by Standard & Poor’s—it now stands well below junk status—amid warnings that “a default could become inevitable in the next few months” unless present circumstances change.
The Ukrainian government needs an additional $15 billion on top of a $17 billion bailout. S&P said that delays in disbursements from the International Monetary Fund and a rundown in foreign currency reserves “increases the risk that the … government might not be able to meet its obligations.”
There are, of course, particular circumstances driving the financial turbulence in Russia and the Ukraine—the impact of international sanctions in Russia and the ongoing war in the Ukraine. However, both countries are an expression of a deeper set of financial problems that are beginning to confront so-called emerging market economies.
The quantitative easing program of the US Fed, which has seen up to $4 trillion pumped into the financial system over the past six years, has fuelled an explosion of debt in these countries, most of it dollar denominated. This means any move towards normalisation of the interest regime in the US, leading to an increase in the value of dollar, increases the debt and interest rate burden of these countries and their corporations.
The numbers involved are significant. According to the Bank for International Settlements, there is $2.6 trillion worth of outstanding international debt securities issued by corporations in emerging market economies, three quarters of which are in dollars.
On top of this, international banks have lent some $3.1 trillion in hard currency to emerging market borrowers. In other words, $5.7 trillion worth of debt is vulnerable to a rise in US interest rates and the dollar. The scene is being set for a repeat of the Asian financial crisis of 1997-98, only on a much larger scale because emerging markets are far more integrated into the global financial system than they were then and their economies now account for around half of global economic output.
There are signs that financial stress is extending beyond those countries, such as Nigeria, Russia and Venezuela, immediately affected by the oil slump. The Turkish lira has fallen throughout this month and is down by 12 percent and Indonesian authorities had to intervene last week to defend the rupiah. The Brazilian real is at a 10-year low against the dollar as is an index of emerging markets currencies.
There is an inherent contradiction in the present situation. The more the US economy shows evidence of a “recovery,” the greater will be the upward pressure on interest rates and the US dollar. But such a movement could well set in motion a crisis in emerging markets which will rapidly impact on the US and global financial system.

Here Is The Reason For The "Surge" In Q3 GDP

Back in June, when we were looking at the final Q1 GDP print, we discovered something very surprising: after the BEA had first reported that absent for Obamacare, Q1 GDP would have been negative in its first Q1 GDP report, subsequent GDP prints imploded as a result of what is now believed to be the polar vortex. But the real surprise was that the Obamacare boost was, in the final print, revised massively lower to actually reduce GDP!
This is how the unprecedented trimming of Obamacare's contribution to GDP looked like back then.


Of course, even back then we knew what this means: payback is coming, and all the BEA is looking for is the right quarter in which to insert the "GDP boost". This is what we said verbatim:
Don't worry thought: this is actually great news! Because the brilliant propaganda minds at the Dept of Commerce figured out something banks also realized with the stub "kitchen sink" quarter in November 2008. Namely, since Q1 is a total loss in GDP terms, let's just remove Obamacare spending as a contributor to Q1 GDP and just shove it in Q2.

Stated otherwise, some $40 billion in PCE that was supposed to boost Q1 GDP will now be added to Q2-Q4.

And now, we all await as the US department of truth says, with a straight face, that in Q2 the US GDP "grew" by over 5% (no really: you'll see).
Well, we were wrong: it wasn't Q2. It was Q3, albeit precisely in the Q2-Q4 interval we expected.
Fast forward to today when as every pundit is happy to report, the final estimate of Q3 GDP indeed rose by 5% (no really, just as we predicted), with a surge in personal consumption being the main driver of US growth in the June-September quarter. As noted before, between the second revision of the Q3 GDP number and its final print, Personal Consumption increased from 2.2% to 3.2% Q/Q,  and ended up contributing 2.21% of the final 4.96% GDP amount, up from 1.51%.
So what did Americans supposedly spend so much more on compared to the previous revision released one month ago? Was it cars? Furnishings? Housing and Utilities? Recreational Goods and RVs? Or maybe nondurable goods and financial services?
Actually no. The answer, just as we predicted precisely 6 months ago is... well, just see for yourselves.

In short, two-thirds of the "boost" to final Q3 personal consumption came from, drumroll, the same Obamacare which initially was supposed to boost Q1 GDP until the "polar vortex" crashed the number so badly, the BEA decided to pull it completely and leave this "growth dry powder" for another quarter. That quarter was Q3.
Source: Q3 GDP report: second revision, Q3 GDP report: final revision

T. Boone Pickens Rages On CNBC: “I Am The Expert, Not You”, Says Oil Down Due To “Weak Demand”


“demand is down” – “lower demand is the main driver” – “rig count is gonna fall – drop 500 rigs in next 6-9 months”


Capex cuts coming… oil prices may be back at $90-100 Brent in 12-18 months but not without rig counts plunging.
At 4:15 Pickens starts to discuss Peak Oil… enjoy -
CNBC: “Peak Oil didn’t happen” ..
Pickens: “that’s all bullshit… I am the expert not you” CNBC: “well you’re not much of an expert if you thought Peak Oil happened”

Enjoy some real-life pushback on the narrative… (apologies for audio quality)
http://www.zerohedge.com/news/2014-12-23/t-boone-pickens-rages-cnbc-i-am-expert-not-you-says-oil-down-due-weak-demand