by Charles Hugh-Smith
A retrace that fills open gaps and kisses the 50-day moving average surprises everyone who was confident oil was heading straight down to $40/barrel.
When the conventional media ordains oil inevitably dropping to $40/barrel, I start looking for something else to happen–like oil going to $70/barrel. There are number of reasons this isn’t as farfetched as it might seem at the moment.
1. The huge gap begging to be filled on the chart of the Energy Select Sector exchange-traded fund XLE and a bunch of other energy-sector stocks and etfs. Gaps like this usually get filled sooner rather than later.
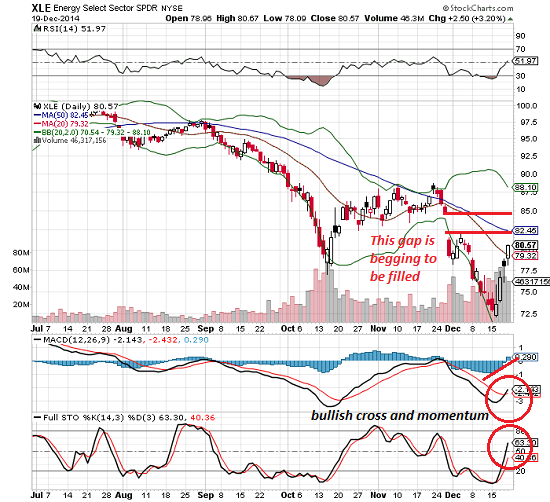
2. A bounce back to the 50-day moving average on the WTI oil index around $73 would be unsurprising. As the old saying has it, nothing goes down in a straight line, and since oil fell in a parabolic curve down, some sort of retrace to a key technical level of resistance is to be expected.
There are many ways to calculate Fibonacci levels, but a retrace to the 38.2% level equates to the mid-$70s.By my reckoning, the natural starting place is the recent high around $116 in 2011 to the recent low around $53. The 38.2% level is $24 + $53 = $77.
Maybe price doesn’t retrace all the way to the mid-$70s, but the possibility shouldn’t be discounted.
3. Too many punters have bet on oil dropping straight to $40/barrel, and all those put options offer the big financial players an incentive to spark a short-covering rally that outruns stops and scoops all the money by options expiration on January 16, 2015.
The more puts there are at $70/barrel (and equivalent levels in energy etfs, oil services stocks, etc., the greater the incentive to push the short-covering rally higher than expected.
4. The parabolic drop in oil resulted more from the panicky unwinding of a crowded and overleveraged trade than supply-demand. As I explained in my series on the financialization of oil, the financial pyramiding of oil is much less visible than supply and demand, so the mainstream media focuses on what’s easy, i.e. supply and demand issues.
The Oil-Drenched Black Swan, Part 4: The Head-Fake Disruption Ahead (December 4, 2014)
The Oil-Drenched Black Swan, Part 3: Multiple Risks, Multiple Unknowns (December 3, 2014)
The Oil-Drenched Black Swan, Part 2: The Financialization of Oil (December 2, 2014)
The Oil-Drenched Black Swan, Part 1 (December 1, 2014)
Crowded trades (trades where almost everyone is on one side of the boat) unwind in precisely this sort of freefall. Once the trade has been unwound, however, the selling cascade exhausts itself and insiders who know better start buying. Buying begets buying, shorts start covering, and voila, a retrace that fills open gaps and kisses the 50-day moving average surprises everyone who was confident oil was heading straight down to $40/barrel.
A retrace that fills open gaps and kisses the 50-day moving average surprises everyone who was confident oil was heading straight down to $40/barrel.
When the conventional media ordains oil inevitably dropping to $40/barrel, I start looking for something else to happen–like oil going to $70/barrel. There are number of reasons this isn’t as farfetched as it might seem at the moment.
1. The huge gap begging to be filled on the chart of the Energy Select Sector exchange-traded fund XLE and a bunch of other energy-sector stocks and etfs. Gaps like this usually get filled sooner rather than later.
2. A bounce back to the 50-day moving average on the WTI oil index around $73 would be unsurprising. As the old saying has it, nothing goes down in a straight line, and since oil fell in a parabolic curve down, some sort of retrace to a key technical level of resistance is to be expected.
There are many ways to calculate Fibonacci levels, but a retrace to the 38.2% level equates to the mid-$70s.By my reckoning, the natural starting place is the recent high around $116 in 2011 to the recent low around $53. The 38.2% level is $24 + $53 = $77.
Maybe price doesn’t retrace all the way to the mid-$70s, but the possibility shouldn’t be discounted.
3. Too many punters have bet on oil dropping straight to $40/barrel, and all those put options offer the big financial players an incentive to spark a short-covering rally that outruns stops and scoops all the money by options expiration on January 16, 2015.
The more puts there are at $70/barrel (and equivalent levels in energy etfs, oil services stocks, etc., the greater the incentive to push the short-covering rally higher than expected.
4. The parabolic drop in oil resulted more from the panicky unwinding of a crowded and overleveraged trade than supply-demand. As I explained in my series on the financialization of oil, the financial pyramiding of oil is much less visible than supply and demand, so the mainstream media focuses on what’s easy, i.e. supply and demand issues.
The Oil-Drenched Black Swan, Part 4: The Head-Fake Disruption Ahead (December 4, 2014)
The Oil-Drenched Black Swan, Part 3: Multiple Risks, Multiple Unknowns (December 3, 2014)
The Oil-Drenched Black Swan, Part 2: The Financialization of Oil (December 2, 2014)
The Oil-Drenched Black Swan, Part 1 (December 1, 2014)
Crowded trades (trades where almost everyone is on one side of the boat) unwind in precisely this sort of freefall. Once the trade has been unwound, however, the selling cascade exhausts itself and insiders who know better start buying. Buying begets buying, shorts start covering, and voila, a retrace that fills open gaps and kisses the 50-day moving average surprises everyone who was confident oil was heading straight down to $40/barrel.
No comments:
Post a Comment