Manic
speculators betting on stocks with RECORD HIGH MARGIN DEBT in
conjunction with HOPIUM AND FALSE PERCEPTIONS is what has caused
stock prices to rise and they will FALL EVEN MORE QUICKLY AS REALITY
RETURNS.
WHY WORRY:? IT”S ONLY A MARKET CRASH
HAPPENING NOW…
It isn’t often that financial bubbles burst,
so the recent carnage in so-called momentum stocks ought to be front
page news. Former highflyers Tesla Motors, Netflix, Twitter,
and 3D Systems are 24%, 28%, 45% and 50% off their recent highs
respectively. Biotechnology stocks are in official bear market
territory, down 21%. Gracing the covers of popular business
magazines, one might expect to see an irritated bear, dejected
trader, or stock chart headed south, background in black. Yet a
quick scan of the financial headlines this past weekend shows little
concern:
- MarketWatch.com – “Stocks fall as volume rises, but here’s why not to worry”
- The Wall Street Journal – “Stock-Market Jitters Put Investors at Ease; Recent Turbulence Is Seen as a Healthy Sign”
- CNBC – “Last week’s big selloff ‘probably over’: Pro”
- MarketWatch.com – “Don’t let these stock market gyrations scare you; It’s likely that we’ve seen the end of recent declines”
The common theme
among investment pundits is that the momentum
bust is isolated, contained, healthy, and even predictable.
AMAZON STOCK PLUMMETS 10% – NEEDS TO FALL
97.5%…
Minyanville: What Amazon customers can expect
this year – USA TODAY
It had to happen sooner or later. Amazon stock
tanked nearly 10% in early trading Friday as investors absorbed the
company’s outlook for yet another quarter in which current profits
will be sacrificed for investment in the future.
AMAZON STOCK IS 3900% OVERVALUED…
Amazon stock is actually 3900% OVERVALUED based
on the math of its PE being 600 when the normal PE is 15. To
get the overvaluation percentage you divide 600 by 15 which equals 40
which equates to 4000%, and less the 100% of actual value that means
that those stocks are overvalued by 3900%.. The amount Amazon
stock needs to fall from its current PE valuations of 600 to the
normal PE valuation is 81.25% based on taking 600 and subtracting 15
and getting 585 and then dividing 585 by 600 which equals 97.5 which
equates to 97.5%. Math never lies and is always
absolute. Folks should try using it more often…
STOCK MARKETS ALWAYS CRASH FROM THE TOP WHEN
NEARLY ALL OF THE FOOLS SPECULATING IN THEM ARE CERTAIN THEY CAN DO
NOTHING BUT CONTINUE TO KEEP GOING UP FOWEVER. ALWAYS.
In the social media space, the bloodletting has
been ugly. The Social Media ETF SOCL is down 23%, but stronger stocks
like Facebook (down 16% from its high a month ago) paper over
individual fiascos, like Twitter, which has plummeted 48% from its
peak last year to below its IPO price.
We are now in the early stage of the biggest
crash stock markets have ever had in the US which will be
considerably worse than the crashes of 2000 and 2008. Margin
debt is at record high levels and that has ALWAYS preceded huge
market crashes.
Speculating with credit like there’s no
tomorrow – Bubble Bubble
STOCK CRASHES IN PROGRESS…The NASDAQ BioTech
Index has PLUMMETED 15% in the past 6 weeks and some bioltech stocks
are down as much as 60% since mid-March. Farcebook has plunged
16% over the past month and the Social Media ETF SOCL is down 23%,
while Twitter has plummeted 48% over the past 6 weeks.
The report on Friday from BLS confirmed that
NEARLY 92 MILLION AMERICANS ARE NOW UNEMPLOYED which is NEARLY
ONE-THIRD OF ALL AMERICANS and an ABSOLUTE RECORD HIGH FOR
UNEMPLOYMENT IN THE US that VASTLY EXCEEDS THAT OF THE GREAT
DEPRESSION in the 1930s.
Real
unemployment rate 59% – Labor Force Statistics from the Current
Population Survey
Official numbers from the Bureau of Labor
Statistics for April. Click on “civilian labor force level” to
see the numbers.
155,421,000 — that is 155 million willing and
able to work. If 92 million are out of work the unemployment rate is
59%
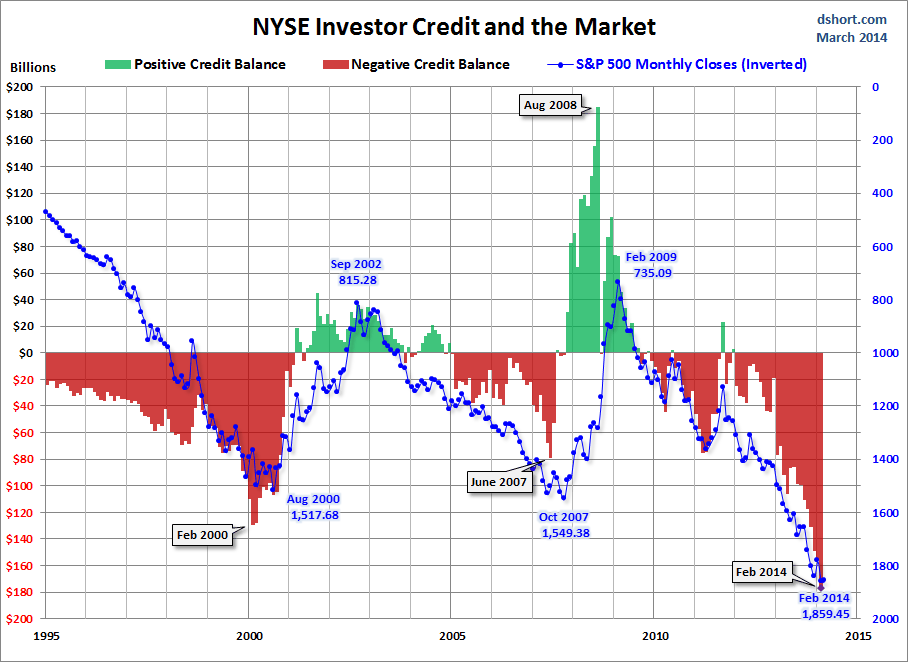
Margin debt takes a turn from all-time high
levels. Be concerned?

CLICK
ON CHART TO ENLARGE
It
doesn’t matter until it matters! Will a decline in margin debt from
all-time highs matter this time? Doug Short each month does an
excellent analysis on margin debt and the latest update is now out.
(see
current info here)
In the past margin debt at historical levels
didn’t seem to matter, until margin debt started decreasing. The
above chart highlights that at each (1), margin debt was at
historical highs and then turned south and the S&P 500 soon
followed.
In my humble opinion one should not look at
margin debt as the holy grail to portfolio construction. It has been
a good tool in helping to know when to overweight and underweight
towards risk assets.
Margin debt has been swiftly pushing higher for
the past 8 months in a row and now slipped a little this past month.
IF….IF margin debt should start decreasing swiftly, history would
suggest something different is taking place in the mind of aggressive
investors.
-
See more at:
http://blog.kimblechartingsolutions.com/2014/05/margin-debt-takes-a-turn-from-all-time-high-levels-be-concerned/#sthash.gI5cPF0J.dpuf
Chas Caldwell
No comments:
Post a Comment