If the advance from January 2013 to the top
in early 2014 isn’t a blow-off top, it’s certainly a pretty good
imitation of one.
Technical analysis seeks to identify trends
and recognize signals. The predictive value of trends (up,
flat or down) and signals (buy, hold or sell) is self-evident, hence
the widespread interest in charts of price and various indicators.
It’s easy to overwhelm the senses with
complex analysis, so let’s try to strip down our look at the NASDAQ
stock index to bare essentials. The opportunities to load up
any chart or analysis with complexity are endless in an age of data
and cheap computational power, and the risk is we miss the forest for
the trees.
Let’s start with a short-term chart of the
NAZ. The classic topping pattern is calledhead and
shoulders because as doubts about the Bull Market start to
creep in, sellers take the market down. This forms the left shoulder.
Despite narrowing breadth and weakening volume,
true-believer Bulls (“this time it’s different”) push the index
to new highs. This forms the head.
The weakening participation (i.e. the market
has run out of new buyers) eventually causes the market to sell off
again. But Bulls, well-trained to “buy the dip,” come back in and
the index rallies, but not to the previous high. This forms the right
shoulder.
Once the Bulls realize the rally is over,
selling begins in earnest as participants sell to lock in gains/limit
losses. Selling begets selling and a Bear market ensues.
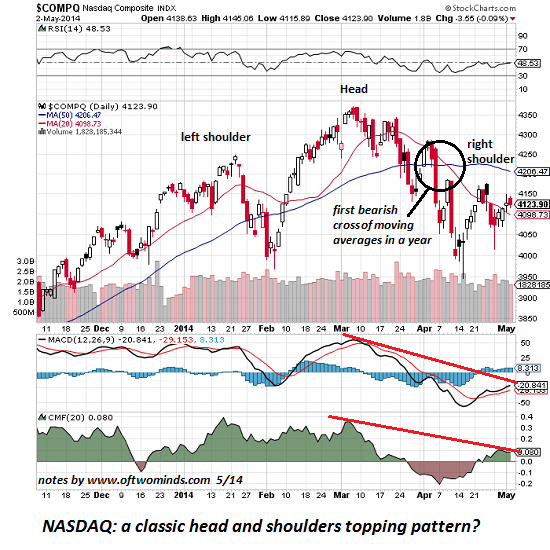
MACD and Chaiken Money Flow reveal the decline
in technical underpinnings.
The long-term chart helps us answer the
question, is this a blow-off top? Another classic pattern is
an A-B-C-D series, in which the first leg up is followed by a decline
that is then followed by a third leg that is roughly twice the size
of the first advance.
Interestingly, the NASDAQ index has traced
out a textbook example of this pattern:the A leg from the 2002
low of 1,114 to the 2007 high of 2,841 is an advance of 1,747. The B
decline from 2,861 to the low in March 2009 of 1,265 is 1,596 points,
and the subsequent C leg reached 4,371 in 2014, a rise of 3,106
points–pretty close to double the A and B legs.
If the advance from January 2013 to the top
in early 2014 isn’t a blow-off top, it’s certainly a pretty good
imitation of one. If a 45% leap in a little over a year
doesn’t qualify as a blow-off top, then what does?
If this A-B-C pattern plays out, the NASDAQ
should experience a major D leg decline.A hefty 30% decline would
simply return the NAZ to its pre-blow-off level around 3,000. Some
projections call for a much more severe decline, but we’ll take
each development as it comes.
If the NASDAQ surpasses the high of 4,371 and
moves higher, the head and shoulders pattern is negated. If the NAZ
fails to rally to new highs, that could be a signal that the rally
from 2009 is reversing or has entered a new phase.
No comments:
Post a Comment