Disclosure: I have no positions in any stocks mentioned, and no plans to initiate any positions within the next 72 hours.
Warning: The following article contains data that some
might find shocking. While the figures are grounded, they are not
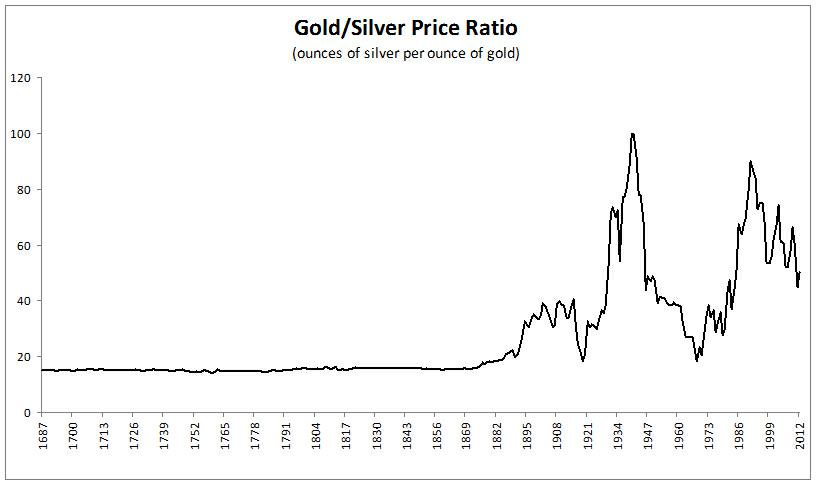
necessarily forecasts.Since 1687, the gold-to-silver ratio has ranged from 14.14 to 99.76 (see chart below). Over this period, the average gold-to-silver ratio was 27.28 and today (March 8, 2012) the gold-to-silver ratio is 50.09.
If silver were to rise to bring the gold-to-silver ratio back to its long-term average, the silver price must rise to $61/oz. (Of course, gold (GLD) prices could also fall to lower the ratio. But let's assume gold is priced at fair value.)
If the ratio were to return to the pre-1900 average of 16.13, the silver price would have to rise to about $105/oz.
Source: Measuring Worth - The source of recent annual London Market Prices is the average of the daily London PM Fix found at Kitco. This is the price most users quote. The source of recent annual New York Market Prices for 2011 is from the U.S. Geological Survey and is an estimated value that may be revised.
Why might the historical gold-to-silver ratio have a natural average much lower than it is today? The chart below shows that the lower ratio might have a geological origin.
page 1 / 2
| Next
No comments:
Post a Comment