When the S&P 500 first hit 2130 back in May 2015, reported LTM earnings were $99.25 per share, and that was already down 6.4% from the cyclical high of $106 per share in September 2014. Thus, stocks were being valued at a nosebleed 21.5X in the face of falling earnings.
During the four quarters since then, reported LTM earnings have slumped by a further 12.3% to $87 per share. So that brings the “cap rate” to 24.5X earnings that have shrunk by 18% over the last six quarters. Wee!
You have to use the
parenthetical because the casino is not capitalizing anything rational.
It’s just drifting higher in daredevil fashion until something big and
nasty stops it.
That something would be global deflation and US recession. Both are racing down the pike at accelerating speed.Needless to say, when these lethal economic forces finally hit home, the puppy pile-up on Wall Street is going to be one bloody mess. But that’s the price you pay when you have destroyed honest price discovery entirely, and have transformed the money and capital markets into robo-machine driven venues of rank speculation.
Janet Yellen and the other 100 clowns who run the world’s central banks, of course, have no clue as to the financial doomsday machine they have enabled. Indeed, they apparently think efficient pricing and allocation of capital doesn’t matter.
After all, their entire modus operandi is to peg the price of money, bonds and the yield curve sharply below market-clearing levels—–so that households and business will borrow and spend more than otherwise.
Likewise, they aim to goose stock prices to ever higher levels. That’s so the top 10% and the top 1%, who own the preponderant share of equities, will feel the wealth(effects) and then spend-up and invest-up a storm.
But the economic gods created market-based price discovery for a reason. It was to insure that in the great arena of financial market supply and demand, the forces of fear and greed would contend on a level playing field. Short-sellers and contrarians heading south were to intercept the lemmings of greed heading north before they reached the edge of the cliff.
Now there is nothing but cliff. Central bankers have euthanized the short-sellers and empowered the lemmings of greed with free money to fund every manner of speculation while gifting them with cheap downside hedging insurance.
There is an awful price to be paid for one-way markets, however. The latter never correct; they crash.
And the suddenness, unexpectedness, and violence of these episodic crashes slam the main street economy with gale force. That confidence shock, in turn, cancels out the gains that the resilient forces of capitalism have eked out since the previous crash, thereby causing trend rates of gain in real output and wealth to fade toward the flat-line and even below.
In short, by enabling the casino to fly blind monetary central planning functions as the enemy of capitalist prosperity. The gambling ethos it implants in the financial markets degrades analysis and dumbs-down incoming economic and financial information to the point of uselessness.
That’s the essence of what happened with the June jobs report. Within minutes of its release, Dow-Jones’ MarketWatch turned the June reports report into a stock market ignition switch:
Hiring in the U.S. roared back in June with a gain of 287,000 new jobs, largely putting to rest lingering worries that the labor market and broader economy had taken a turn for the worse…..The sharp rebound in hiring last month….. suggest(s) the labor market remains the healthiest it’s been in years. The June jobs report also offers confirmation the U.S. economy is expanding at a moderate pace and keeping a seven-year-old recovery intact.Except the internals and trends of the report didn’t say that at all. MarketWatch was just dispensing algo-reader headline bait.
Indeed, within another hour or so, one of the great market analysts still in business, David Rosenburg, dispatched the euphoria with alacrity:
The simple fact of the matter is that May and June were massive statistical anomalies. The broad trends tell the tale. Go back to June 2014 and the six-month trend in payrolls is running at a 2.2% annual rate and the three-month trend at 2.4%. A year ago, as of June 2015, the six-month pace was 1.9% and the three-month at 2.2%. Fast forward to today, and the six-month annualized rate is 1.4% and the three-month has slowed all the way down to a 1.2%. This is otherwise known as looking at the big picture.In fact, you don’t even have to puzzle through the wild swings emanating from the BLS random numbers generator to know that the actual US economy and labor market is weakening rapidly.
When the Household survey is put on the same comparable footing as the payroll series (the payroll and population-concept adjusted number), employment fell 119,000 in June — again calling into question the veracity of the actual payroll report — and is down 517,000 through this span. The six-month trend has dipped below the zero-line and this has happened but two other times during this seven-year expansion.”
That is, the BLS establishment survey gains of 144k, 11k and 287k for April, May and June, respectively, amounting to a statistical average of 147,000. But that tells you nothing about the trend and almost certainly overstates what is actually happening in the jobs market.
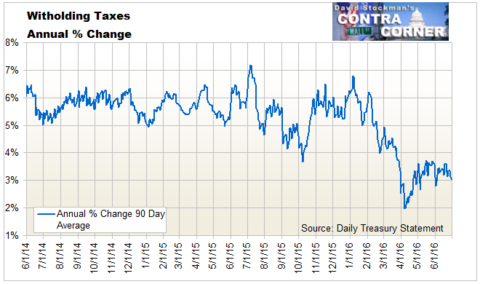
As we have long insisted, there is absolutely no need for the essentially useless BLS employment report in the first place. That’s because the daily payroll tax withholding receipts of the US Treasury tell you all you need to know, and with one huge advantage to boot.
To my knowledge, there is no sentient employer in the US who sends payroll tax money to Washington based on phantom jobs owing to seasonal adjustments, birth-death imputations or trend-cycle adjusted models which recalibrate shop floor headcounts to fit a prior trend.
Accordingly, if you strip from the payroll tax data an allowance for any tax policy changes, and allow for the going rate of nominal wage increase, you essentially get a proxy for real units of labor input to the American economy.
That is to say, you get real time estimates of labor hours worked, not medicated and manipulated statistical model projections of what a handful of GS-16s think the census count in the nation’s workplaces should have been.
Now, according to the US treasury’s cash box, June employment did not come “roaring” back at all. To the contrary, it has continued to skid, and has been for several months now.
To wit, compared to a 5-6% average annual gain late last year, the collections trend has now fallen to just 3%. Strip out of that the 2.6% annualized rate of hourly wage and salary inflation reported for June and you get hardly a 0.5% growth in real labor inputs.
And that’s not the half of it. The above data probably understate the slowdown because they represent a three-month moving average designed to strain out seasonal and calendar effects. More recent tax collections data suggest the US economy may be barely treading water.
The truth is, monthly BLS data is so statistically modeled and manipulated that it is useless. Only after several years of revisions and benchmarkings based on state unemployment insurance rolls and Federal tax data do the BLS figures move out of the realm of models and into the world of empirics.
That’s why the BLS monthly numbers have such a well-deserved reputation as lagging indicators. During the 2008-2010 jobs downturn, for example, initially reported numbers were reduce by millions of jobs after re-benchmarkings. The BLS’ momentum based models drastically over-projected current rapidly weakening conditions in the labor market.
Indeed, there is plenty of evidence on the Treasury tax collection data that suggests we are at an economic turning point again and that the BLS monthly numbers are again overstating the jobs market reality.
During the first nine months of FY 2016 (starting in October) individual income tax collections were $1.171 trillion. That was up just 0.3% from the $1.167 trillion collected in FY2015.
Likewise, corporate tax collections of $224 billion over the last nine months were down $32 billion or 12.5% from prior year. Those figures don’t fit any kind of rebound narrative, but there is probably a common factor at work.
That is, within total payroll tax collections (income and OASDHI), withholding collections are up by 3.7% for the first nine months of FY 2016, whereas the net of estimated payments by non-withholders and refunds is down by nearly 7%. In a word, when the economy cools down, corporate profits, employee bonuses and contract hires get hit first, and that’s exactly what these figures suggest.
In any event, the tax collection numbers for June are nothing short of a disaster. My colleague, Lee Adler, recently documented withholding tax collections hit the flat-line in June, coming in at $180.6 billion compared to $180.0 billion last June.
That’s not a “roaring” jobs market; it’s a 0.3% rounding error.
Worse still, non-withheld taxes in June, which reflect bonuses and estimated payments for anticipated earnings, dropped from $76.7 billion last year to$62.3 billion this year. And that’s not just a rounding error; it’s a 19% plunge.
Likewise, corporate tax collections in June dropped from $74.9 billion last year to $62.8 billion this year. That’s a 16.2% drop.
Finally, even excise tax collections are down by nearly 3%. Since they reflect twice monthly payments based on current sales, it is hard to see how that is consistent with an economy that is purportedly bounding forward.
What I learned the hard way decades ago in the Reagan White House is that when tax collections are down, the economy is already in the drink. So that fact that total Federal tax collections came in at $300.6 billion in June compared to $327.5 billion last year completely trumps the headline noise issued by the BLS Friday morning.
Yes, there are always calendar effects and other quirks in the monthly numbers, but an 8.2% year-over-year drop in Uncle Sam’s skim from the US economy is a huge yellow flag, to say the least.
In short, there is nothing going on in the US economy that merited Friday’s monkeyshiners’ celebration. and the headline BLS number was about the closest thing to pure statistical noise that you can find.
Nevertheless, even the internals of the report were a reminder that the US jobs market is extremely unhealthy, and, in fact, this business cycle is running out of gas after 84 months of tepid expansion.
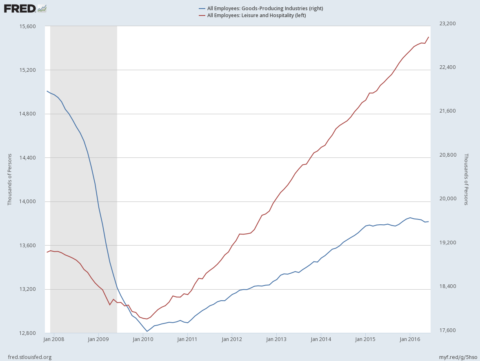
Aside from the 40,000 jobs attributable to the Verizon strikers returning, the composition of the headline number was terrible. For instance, in the 19.6 million good producing sector there were a total of 9,000 new jobs, including none in construction, a loss in energy and mining and a tepid gain of 0.1% in manufacturing.
By contrast, there was a gain of 59,000 waiters, bartenders and bus boys in the leisure and hospitality category. But these are obviously not interchangeable slots, even though the BLS counts them all the same.
To wit, the average goods-producing job averages 40.3 hours per week at$26.90 per hour. On an annualized basis that’s a cash wage of $56,400.
By contrast, leisure and hospitality jobs are part-time, averaging just 26.0hours per week at an average wage of $14.89 per hour. That amounts to an annualized cash wage of only $20,100. So it’s 35% of a job compared to the goods-producing sector.
Here’s the thing. The entire period since the year 2000 has exhibited a process of replacing high pay jobs with low pay jobs, and that process has accelerated during the last seven years of so-called recovery.
The June report, in fact, confirmed that this huge problematic trend has now taken an “end of the cycle” turn for the worse. To wit, during the seven months since last November, the number of goods producing jobs reported (and revised several times already) by the BLS has declined by 3,000.
What has been gaining has been the 35% jobs in the leisure and hospitality sector, among others. That category is up by a whopping 200,000 since last November.
Likewise, the count in the retail sector, where jobs average 31.2 hours per week and $17.85 per hour, is also up by 200,000 since last November. Alas, at $29,000 per year in cash wages these are 51% jobs.
In short, there was nothing in the June report to contradict the notion that the productivity and earnings capacity of the US labor force, as reflected in the headline BLS number, is actually steadily eroding.
In fact, the report showed that since December, the index of aggregate weekly hours is up at only a 0.2% annualized rate. Likewise, nonfarm labor productivity rose by only 0.7% during the year ended in Q1 2016.
It is an economic truism, of course, that without hours growth and productivity growth, you do not get economic output growth; and without the latter you do not get profit growth.
Needless to say, that is exactly where we are at present—–with no prospect of escaping a long-in-the-tooth business cycle expansion that is now rapidly waning. And that means that the capitalization rate for corporate earnings should be coming down, not soaring into the nosebleed section of history.
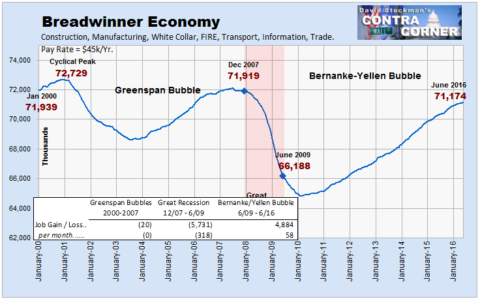
The chart below is simply a reminder that in the present era of central bank driven Bubble Finance, financial asset prices have been thoroughly disconnected from the economic fundamentals. The US economy has lost 2.3million goods-producing jobs since the year 2000 and replaced them with2.6 million 35% jobs in hospitality and leisure.
That does not bespeak a roaring engine of capitalist prosperity and occasion for the highest PE ratios in history. The fact that we have the latter merely reflects that the casino is crowded with monkeyshiners high on the monetary drugs dispensed by today’s central bankers.
In fact, the evidence that this third crack-up boom of the 21st century is heading for a crash landing was once again reinforced by the June jobs report. Namely, there were still 1.6 million fewer full-time, full-pay “breadwinner” jobs than when Bill Clinton was packing his bags to shuffle out of the White House.
That’s not a 24.5X economy. Not even close.
No comments:
Post a Comment