by Charles Hugh-Smith
Based on historical gold-oil ratios, oil appears extraordinarily cheap right now.
One way to establish if a commodity or asset is relatively expensive or inexpensive is to price it in something other than a fiat currency–for example, gold. Gold goes up and down in value relative to other commodities and fiat currencies, so it is itself a volatile yardstick. Nonetheless, it provides a useful measure of the relative value of gold and whatever is being measured in gold–in this case, oil.
The prices listed are approximate, i.e. rounded to averages in the time frame listed. Of the various measures of oil, I am using WTIC.
According to SRSrocco REPORT, the average gold-oil ratio in the period 2000-2014 is 12. That is, on average, one ounce of gold bought about 12 barrels of oil.
For historical context, in 1976, following the first oil-shock in 1973, oil was $12.80/barrel and gold was around $124, for a ratio of 9.7.
In 1986, the average price of gold wasaround $368 while oil fell to $14/barrel, for a ratio of 26.3.
At gold’s peak above $1,800/ounce in 2011, oil was around $90/brl, for a ratio of 20.
At oil’s peak above $140/barrel in 2008, gold was around $950/ounce, for a ratio of 6.8.
As a rule of thumb, oil is relatively expensive (and gold is relatively inexpensive) when the ratio is below 9, and oil is relatively inexpensive (and gold is relatively expensive) when the ratio is above 20.
When oil fell below $55/barrel a few days ago, the ratio reached 22. By historical standards, oil is cheap.
Here is a listing of various highs and lows in gold and oil:
Oil priced in gold: how many barrels of oil can be purchased with one ounce of gold?
2000: Oil $30/brl, gold $275
Ratio: 9.2
2006: Oil $70/brl, gold $600
Ratio: 8.6
2008: Oil $140/brl (at the peak), gold $950
Ratio: 6.8
2011: Oil $90/brl, gold $1,800 (at the peak)
(note that oil traded above $100/brl earlier in 2011, but at gold’s peak was around $90/brl)
Ratio: 20.0
2014 (1st quarter): Oil $105/brl, gold $1,300
Ratio: 12.3
2014 (current): Oil $55/brl, gold $1,200
Ratio: 21.8
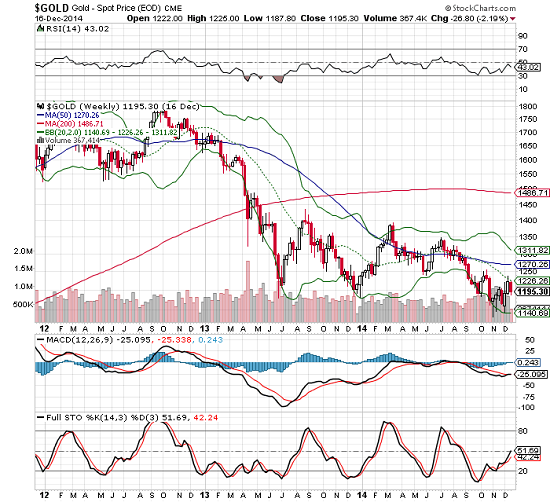
Here is a chart of gold from 2012 to the present:
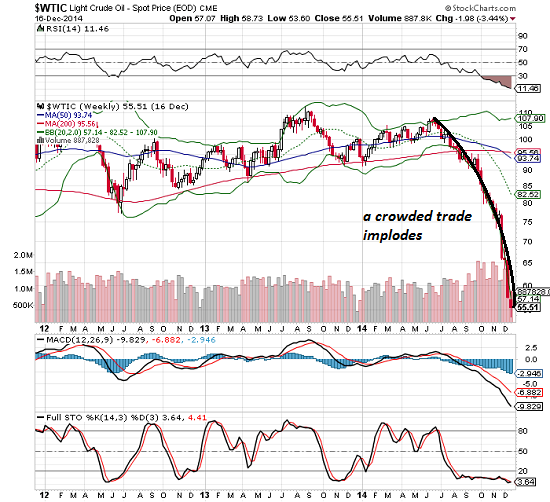
Here is a chart of oil (WTIC) from 2012 to the present:
And here is a chart of the gold-oil ratio from 2012 to the present:
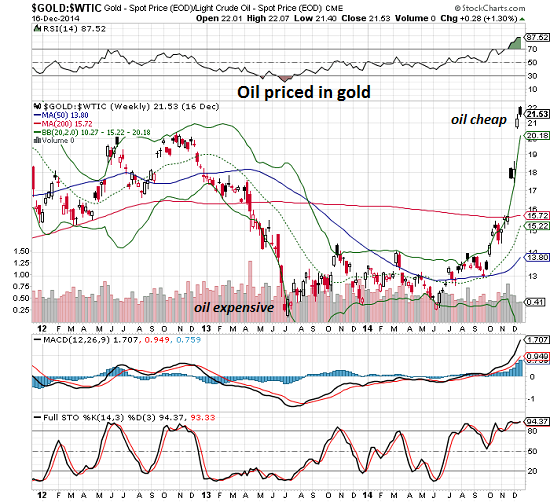
While the gold-oil ratio exceeded 25 three decades ago, in the era of rising demand from the emerging markets of China, India and other nations, the ratio has only touched 20 when gold was trading above $1,800/ounce.
Based on historical gold-oil ratios, oil appears extraordinarily cheap right now. Could oil fall further? Of course. Could gold go up or down? Of course. There are a great many factors that influence the ratio, which is simply a short-hand method of measuring the relative value of two important commodities.
Based on historical gold-oil ratios, oil appears extraordinarily cheap right now.
One way to establish if a commodity or asset is relatively expensive or inexpensive is to price it in something other than a fiat currency–for example, gold. Gold goes up and down in value relative to other commodities and fiat currencies, so it is itself a volatile yardstick. Nonetheless, it provides a useful measure of the relative value of gold and whatever is being measured in gold–in this case, oil.
The prices listed are approximate, i.e. rounded to averages in the time frame listed. Of the various measures of oil, I am using WTIC.
According to SRSrocco REPORT, the average gold-oil ratio in the period 2000-2014 is 12. That is, on average, one ounce of gold bought about 12 barrels of oil.
For historical context, in 1976, following the first oil-shock in 1973, oil was $12.80/barrel and gold was around $124, for a ratio of 9.7.
In 1986, the average price of gold wasaround $368 while oil fell to $14/barrel, for a ratio of 26.3.
At gold’s peak above $1,800/ounce in 2011, oil was around $90/brl, for a ratio of 20.
At oil’s peak above $140/barrel in 2008, gold was around $950/ounce, for a ratio of 6.8.
As a rule of thumb, oil is relatively expensive (and gold is relatively inexpensive) when the ratio is below 9, and oil is relatively inexpensive (and gold is relatively expensive) when the ratio is above 20.
When oil fell below $55/barrel a few days ago, the ratio reached 22. By historical standards, oil is cheap.
Here is a listing of various highs and lows in gold and oil:
Oil priced in gold: how many barrels of oil can be purchased with one ounce of gold?
2000: Oil $30/brl, gold $275
Ratio: 9.2
2006: Oil $70/brl, gold $600
Ratio: 8.6
2008: Oil $140/brl (at the peak), gold $950
Ratio: 6.8
2011: Oil $90/brl, gold $1,800 (at the peak)
(note that oil traded above $100/brl earlier in 2011, but at gold’s peak was around $90/brl)
Ratio: 20.0
2014 (1st quarter): Oil $105/brl, gold $1,300
Ratio: 12.3
2014 (current): Oil $55/brl, gold $1,200
Ratio: 21.8
Here is a chart of gold from 2012 to the present:
Here is a chart of oil (WTIC) from 2012 to the present:
And here is a chart of the gold-oil ratio from 2012 to the present:
While the gold-oil ratio exceeded 25 three decades ago, in the era of rising demand from the emerging markets of China, India and other nations, the ratio has only touched 20 when gold was trading above $1,800/ounce.
Based on historical gold-oil ratios, oil appears extraordinarily cheap right now. Could oil fall further? Of course. Could gold go up or down? Of course. There are a great many factors that influence the ratio, which is simply a short-hand method of measuring the relative value of two important commodities.
No comments:
Post a Comment