The
velocity of money (also called velocity of circulation of money and,
much earlier, currency) is the frequency at which one unit of currency
is used to purchase domestically-produced goods and services within a
given time period.[3] In other words, it is the number of times one
dollar is spent to buy goods and services per unit of time.[3] If the
velocity of money is increasing, then more transactions are occurring
between individuals in an economy.[3] Although once thought to be
constant,[citation needed] it is now understood that the velocity of
money changes over time and is influenced by a variety of factors.[4]
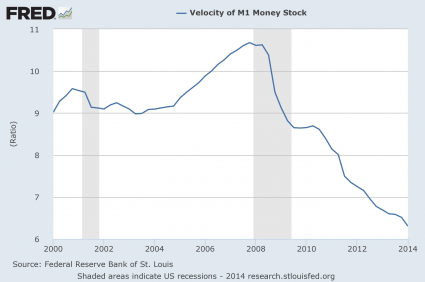
First, let’s look at M1, which is a fairly narrow definition of the money supply. The following is how Investopedia defines M1…
A measure of the money
supply that includes all physical money, such as coins and currency, as
well as demand deposits, checking accounts and Negotiable Order of
Withdrawal (NOW) accounts. M1 measures the most liquid components of the
money supply, as it contains cash and assets that can quickly be
converted to currency. It does not contain “near money” or “near, near
money” as M2 and M3 do.
As you
can see from the chart posted below, the velocity of M1 normally
declines during a recession. Just look at the shaded areas in the
chart. But a funny thing has happened since the end of the last
recession. The velocity of M1 has just kept falling and it is now at a
nearly 20 year low…
Next, let’s take a look at M2. It includes more things in the money supply. The following is how Investopedia defines M2…
A measure of money supply that includes cash and checking deposits (M1) as well as near money. “Near money” in M2 includes savings deposits, money market mutual funds and other time deposits, which are less liquid and not as suitable as exchange mediums but can be quickly converted into cash or checking deposits.
In the
chart posted below, we can once again see that the velocity of M2
normally slows down during a recession. And we can also see that the
velocity of M2 has continued to slow down in the “post-recession era”
and has now dropped to the lowest level ever recorded…
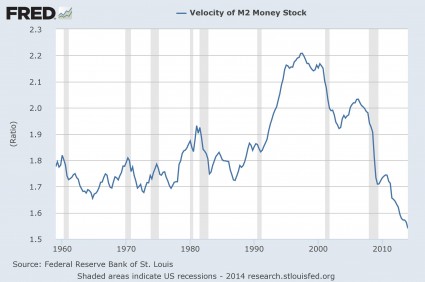
This is a highly deflationary chart.
It clearly indicates that economic activity in the U.S. has been steadily slowing down.
And if we are honest, we have to admit that we are seeing signs of this all around us. Major retailers are closing down stores at the fastest pace since the collapse of Lehman Brothers, consumer confidence is down, trading revenues at the big Wall Street banks are way down, and the steady decline in home sales is more than just a little bit alarming.
In
addition, the employment situation in this country is much less
promising than we have been led to believe. According to a report put
out by the Republicans on the Senate Budget Committee, an all-time
record one out of every eight men in their prime working years are not in the labor force…
In brief: as the below table
shows, out of the 23 countries that have reported so far, 8 reported
improvements in their manufacturing sectors in May, while 15, or
two-thirds, recorded a weakening in mfg data from April. That’s the bad
news, and an indication that the latest upswing in the global
manufacturing economy may be ending. The good news: despite the modest
decline, there were only 7 countries “contracting” or in negative
territory (below 50) and 16 in positive. In particular, France, Korea,
and Norway moved from expansion to contraction.

ISM MANUFACTURING INDEX UNEXPECTEDLY FALLS
Manufacturing
data is fresh out from Europe, and it’s fairly weak looking. While some
countries are doing well (EG Spain), the big powerhouses like Germany
and France aren’t so great. German manufacturing has slowed to a 7-month
low. Meanwhile, France is at a 4-month low, and it remains in
contraction.
UH-OH: Deflation Hits Germany
There’s
lots of evidence this morning that the German economy isn’t looking so
hot. Earlier we mentioned how the country’s manufacturing industry has fallen to a 7-month low.
Now it’s seeing outright deflation in several regions, with prices falling on a sequential basis.
Euro drops after euro-zone PMI falls short of forecast
Japan Orders and Output Decline Second Month; Does it Mean Anything?
Orders
and output in Japan contracted for the second month. However, the
decline was small and it comes on the heels of a tax increase that
shifted demand forward a couple months ago.
Markit reports Slower Decline in Japanese Manufacturing Output in May
Read more at
Stocks are hitting new highs again… but this could be a serious warning sign
From Bloomberg:
Lately, the higher the Standard & Poor’s 500 Index goes, the less investors care.
About 1.8 billion shares traded
each day in S&P 500 companies last month, the fewest since 2008,
according to data compiled by Bloomberg. When the gauge hit an all-time
high on May 23, only about 20 of its 500 companies reached 52-week
highs, the data show. That’s the lowest number in a year.
When volume and breadth wane
even as stocks surge, it’s a warning sign that has preceded losses in
the past, according to Sundial Capital Research Inc. in Blaine,
Minnesota. Hayes Miller, who helps oversee $57 billion at Baring Asset
Management Inc., says the skepticism shows investors distrust a rally
built on Federal Reserve stimulus.
“Breadth is suggesting that the
market is topping,” Miller, the Boston-based head of multi-asset
allocation for Baring, said in a May 28 telephone interview. “This is
not a good starting point for buying equities at this price. We all know
that investors are induced into risk assets by central bank policies,
which keep your safer options very unattractive.”
Exchange-traded and mutual
funds that buy U.S. shares saw $1.2 billion in outflows this quarter,
while bonds received $34 billion, data compiled by Bloomberg and the
Investment Company Institute show. The gap is poised to be the largest
since September 2012.
Stock Outflows
Individuals investing through
the funds only started buying stocks in 2013 after the S&P 500 more
than doubled from its 2009 low. They added more than $150 billion to
funds last year after withdrawing $260 billion in the previous four,
data compiled by ICI and Bloomberg show.
“Over the past couple of months
we’ve seen an increase of flows out of stocks and back to bonds, which
has been a surprise,” Cameron Hinds, the Lincoln, Nebraska-based
regional chief investment officer for Wells Fargo Private Bank, which
has about $170 billion under management, said in a May 29 phone
interview. “We’ve also been surprised by the degree to which the yield
on the 10-year Treasury note has drifted lower.”
The benchmark U.S. 10-year note
saw its yield drop to 2.44 percent last week, the lowest in 11 months.
The S&P 500, rose 2.1 percent to 1,923.57 last month, extending its
gain since December to 4.1 percent.
At an investor conference last
week, Goldman Sachs Group Inc. President Gary Cohn blamed the reduction
in trading on calm markets and the Fed’s efforts to hold down interest
rates.
Falling Volatility
Volatility on the MSCI
All-Country World Index, which tracks stocks in both developed and
emerging markets, dropped to 5.33 on May 28, its lowest level since
1996, according to 30-day historical data compiled by Bloomberg. The
Chicago Board Options Exchange’s Volatility Index, known as the VIX,
closed below 12 for the five previous days, the longest streak since
2007. The measure has a five-year average of 19.9.
“What drives activity in our
business is volatility,” Cohn said in New York on May 28. “If markets
never move or don’t move, our clients really don’t need to transact.”
Citigroup Inc. Chief Financial
Officer John Gerspach said last week that second-quarter trading revenue
could fall as much as 25 percent from year-earlier levels, and JPMorgan
Chase & Co. estimated a 20 percent drop.
John Traynor, chief investment
officer of People’s United Bank Wealth Management in Bridgeport,
Connecticut, finds improving economic growth and earnings more important
than volume. His firm oversees $5.2 billion.
Read more:
During the first quarter of 2014, earnings by major U.S. retailers missed estimates by the biggest margin in 13 years. The “retail apocalypse”
continues to escalate, and the biggest reason for this is the fact that
middle class consumers in the U.S. are tapped out. And this is not
just happening to a few retailers – this is something that is happening
across the board. The following is a summary of how major U.S.
retailers performed in the first quarter of 2014 that was put together by Jim Quinn…
Wal-Mart Profit Plunges By $220 Million as US Store Traffic Declines by 1.4%Target Profit Plunges by $80 Million, 16% Lower Than 2013, as Store Traffic Declines by 2.3%Sears Loses $358 Million in First Quarter as Comparable Store Sales at Sears Plunge by 7.8% and Sales at Kmart Plunge by 5.1%JC Penney Thrilled With Loss of Only $358 Million For the QuarterKohl’s Operating Income Plunges by 17% as Comparable Sales Decline by 3.4%Costco Profit Declines by $84 Million as Comp Store Sales Only Increase by 2%Staples Profit Plunges by 44% as Sales Collapse and Closing Hundreds of StoresGap Income Drops 22% as Same Store Sales FallAmerican Eagle Profits Tumble 86%, Will Close 150 StoresAeropostale Losses $77 Million as Sales Collapse by 12%Best Buy Sales Decline by $300 Million as Margins Decline and Comparable Store Sales Decline by 1.3%Macy’s Profit Flat as Comparable Store Sales decline by 1.4%Dollar General Profit Plummets by 40% as Comp Store Sales Decline by 3.8%Urban Outfitters Earnings Collapse by 20% as Sales StagnateMcDonalds Earnings Fall by $66 Million as US Comp Sales Fall by 1.7%Darden Profit Collapses by 30% as Same Restaurant Sales Plunge by 5.6% and Company Selling Red LobsterTJX Misses Earnings Expectations as Sales & Earnings FlatDick’s Misses Earnings Expectations as Golf Store Sales PlummetHome Depot Misses Earnings Expectations as Customer Traffic Only Rises by 2.2%Lowes Misses Earnings Expectations as Customer Traffic was Flat
That is quite a startling list.
No comments:
Post a Comment