Stocks Turn Red For Year
U.S. stocks on Monday declined for a third
session, pulling the S&P 500 into the red for the year, as
investors shed high-profile assets that fared well in 2013 in search
of better values.
http://www.zerohedge.com/news/2014-04-07/stocks-turn-red-year-while-nasdaq-smashed-most-october-2011
Shakeout
in stocks seen continuing
The shakeout in stocks is likely to continue,
as investors worry there is too little proof the economy can
accelerate enough to counterbalance the Fed’s reversal of its easy
money policy.
CITI Bracing to Miss Profit Target…
Falling internet stocks…
Mortgage
Loan Originations Lowest on Record
Black
Knight’s February
Mortgage Data shows Monthly Loan Originations Lowest on
Record.
Key Points
- Origination volume is the lowest on record with prepay speeds signaling more drops in refi originations
- Monthly sales were essentially flat year over year, but traditional sales were up almost 15%
- The government share of originations has decreased, led by a sharp drop in HARP originations
- Credit standards have shown few signs of loosening, with very little origination activity in the lowest credit score buckets
- Modification re-default rates for underwater borrowers about 30 percent higher than those with equity
Read
more
at http://globaleconomicanalysis.blogspot.com/2014/04/mortgage-loan-originations-lowest-on.html#iUoj8YcJhuP1PWkz.99
This
Jim Chanos Chart Will Convince You We’re At The Peak Of A
Spectacular, Fed-Fueled Bubble
Today
we published the latest installment of our quarterly MOST
IMPORTANT CHARTS IN THE WORLD slidedeck, which contained
contributions from some of the leading lights of the finance world —
economists, analysts, investors, and others.
One
contributor is famed short-seller Jim Chanos, who has been talking
lately about the Sotheby’s Indicator — that is, that the famous
auction house tends to peak when big bubbles peak.
Read more: http://www.businessinsider.com/jim-chanos-chart-2014-4#ixzz2yFsvZnZS
Read more: http://www.businessinsider.com/jim-chanos-chart-2014-4#ixzz2yFsvZnZS
What
In The World Is Happening To The Nasdaq?
All
of a sudden, the Nasdaq is absolutely tanking. On Monday, it
fell more than 1 percent after dropping 3.6 percent on Thursday and
Friday combined. At this point, the Nasdaq is off to the worst
start to a year that we have seen since 2008, and we all remember
what happened back then. So why is this happening? In
recent years, the Nasdaq has been ground zero for “dotcom bubble
2.0″. The hottest stocks in the entire world are on the
Nasdaq – we are talking about stocks like Yahoo, Netflix, Apple,
Tesla, Google and Facebook. Those stocks have gone to
absolutely incredible heights, but now they are starting to fall.
Some are blaming insider selling, and without a doubt the “smart
money” is starting to flee the stock market. Just check
out this
chart. Others are blaming low expectations for
first-quarter earnings or the tapering of quantitative easing by the
Federal Reserve. But whatever is causing this decline, it is
starting to get alarming. The Nasdaq just experienced its
largest three day fall since November 2011.
No stock can resist gravity forever. What
goes up must eventually come down. This is especially true for
stock prices that become grotesquely distorted.
On
Wall Street, a price to earnings ratio of 20 to 25 is usually
considered fairly normal. In recent years, the price to
earnings ratios for many of these “hot tech stocks” have gone
way, way beyond that. For example, posted below is a screen
capture from Bloomberg TV that was featured in a recent Zero
Hedge article…
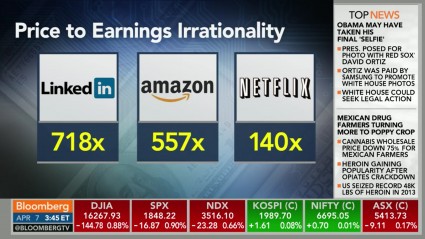
There is no way in the world that such
valuations are justified.
We have been living in another dotcom bubble,
and it was inevitable that it was going to burst at some point.
98%
Of All Consumer Credit In Past Year Was Student And Car Loans
And putting this in context, in the past 12
months, a record 98% of all credit – $162 billion – has gone into
non-revolving debt, i.e., student & car loans. How much has been
added to credit card balances? An absolutely meaningless $4 billion,
or…
No comments:
Post a Comment