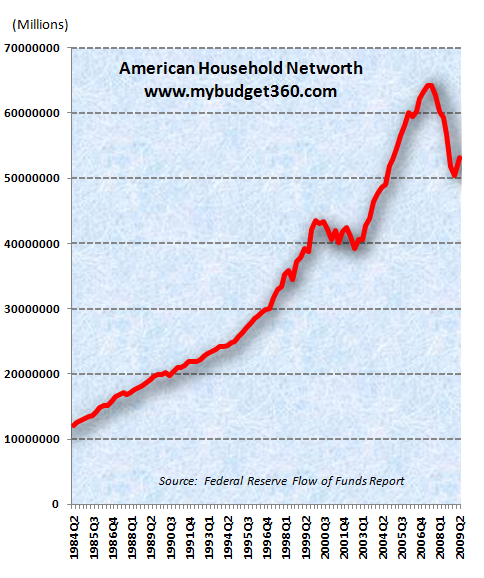
The Federal Flow of Funds report was released on Thursday with an expected jump in household net worth. When we did our last report, we stated that with the $13.89 trillion in wealth that evaporated to the trough, we would expect a jump in net worth to come from the massive stock market rally. The report shows this paper wealth gain that started at the end of Q1. Household net worth increased by $2 trillion from the first quarter to the end of the second quarter of 2009. Much of the increase came from the $1.36 trillion increase in corporate equities and mutual funds. Real estate grew by $139 billion. Yet this increase is merely a reflection of all the liquidity being flushed into the equity markets by the Federal Reserve.
Below is a chart of household net worth:
Keep in mind that American households are still down by $12 trillion from the peak reached in 2007. This quarterly move would be more significant if unemployment and government funds were less of a short-term mover. If anything, what this report tells us is that the only thing that is rallying from the bottom is equities. It is gathering massive steam and price/earnings ratios are not being reflected in the real world.
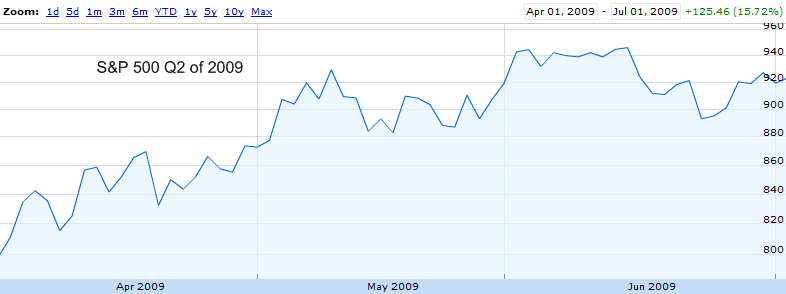
What we see in the current report is merely the reflection of the 60 percent stock market rally. From April to June, the market rallied significantly:
Since then, the third quarter has also seen another increase in the trend upward. So we should expect that when the Q3 report is released that household net worth will increase again driven by equities again. As you can tell, real estate is no longer the driving force even though it is the largest line item for U.S. households.
Current U.S. household net worth: $53 trillion
U.S. household real estate: $20 trillion
So real estate makes up nearly 40 percent of household net worth. Keep in mind that $20 trillion in real estate is secured by $10.4 trillion in mortgages many that are now going bad. Interestingly enough, if you look at the mortgage data it peaks around $10.54 trillion and has fallen to $10.4 trillion. Do we really think that only a few hundred billion in mortgages have gone bad? This is simply a reflection of banks not writing down option ARMs and other questionable assets.
The commercial real estate debt is going to hit and cause more losses in the years to come. Yet this is part of the trend that we will not be seeing in the Q3 report. And if you really want to see something frightening in the report, just look at total debt outstanding:
If you add it up, American households have $13.74 trillion in debt. But look at what American business have in debt. That is another $11.2 trillion and you can rest assured much of that commercial real estate is sitting there. State and local governments are saddled with $2.2 trillion in debt and we all know how tough things are for state governments. Unlike the Federal government, states do not have access to the printing press known as the U.S. Treasury so they have to operate in a financial reality that the Federal government seems to ignore.
The debt is coming out of everywhere. Much of this debt is secured by real estate and commercial properties that are still being valued at peak prices. Stocks reflect optimistic scenarios. So we will see another leg down in 2010 possibly as early as Q4 of 2009 since we are starting to see already some weakness of the $13 trillion in financial bailouts and backstops.
And if anyone thinks that we will ever payoff some $33 trillion in debt they are out of their minds. I’ll let you run the math on that one so you can see how laughable this is. Think about it. If our GDP is $14 trillion or so, it would take us over 2 years of full U.S. productivity to pay off this debt. That will never happen because we are spending along the way. This is like a household making $30,000 a year needing to pay off a $3 million loan. As long as the monthly payment is low, not a big deal right? But we’ll be paying this stuff off for centuries.


No comments:
Post a Comment