Tuesday, May 6, 2014

Earthquake of 6 magnitude strikes Thailand, some damage
BANGKOK (Reuters) - An earthquake of 6 magnitude struck
northern Thailand on Monday causing some damage to buildings and roads
and knocking goods off shelves in shops but there were no immediate
reports of any casualties.
The quake struck 17 miles (27 km) southwest of the town of Chiang
Rai, the U.S. Geological Survey (USGS). It was felt in the Thai capital,
Bangkok, and in neighbouring Myanmar."There has been minor damage to buildings in Chiang Rai itself, some shops have have goods scattered about and we're seeing cracks in buildings," a Chiang Rai police officer told Reuters.
"No injuries have been reported so far but we're hearing that some provincial roads have sustained some damage with large cracks appearing," said the officer, who declined to be identified as he is not authorised to speak to the media.
The USGS initially said the quake was of 6.3 magnitude but later downgraded it. It was at the relatively shallow depth of 7.4 km (4.5 miles).
Chiang Rai, in the mountainous north of Thailand, is near the borders of both Myanmar and Laos. The epicentre was in a largely rural area of small villages, farms and forests.
(Writing by Robert Birsel; Editing by Simon Cameron-Moore)
Earthquake in north Thailand
A strong earthquake shook northern Thailand and Myanmar on Monday evening, smashing windows, cracking walls and roads and damaging Buddhist temples. No casualties were reported.
The airport in Chiang Rai, a northern Thai city near the epicenter of the 6.3-magnitude temblor, evacuated people from its terminal, where display signs and pieces of the ceiling fell. There was no damage to the runway or flight disruptions, airport General Manager Damrong Klongakara said.A well-known temple in the city, the all-white Wat Rongkhun, was closed due to safety concerns after the earthquake. (AP)
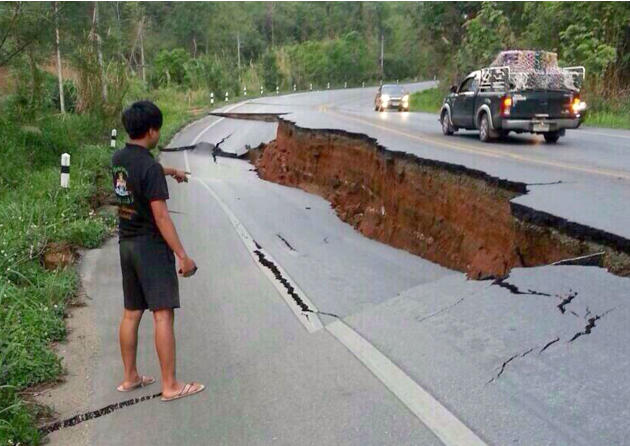
A man points to a large crack on a damaged road following a strong earthquake in Phan district of Chiang Rai province, northern Thailand, Monday, May 5, 2014. A strong earthquake shook northern Thailand and Myanmar Monday evening, and some light damage was reported. (AP Photo)
 Goods at a grocery store fallen
from from the shelves after an earthquake in Chiang Rai province,
northern Thailand Monday, May 5, 2014. (AP Photo)
Goods at a grocery store fallen
from from the shelves after an earthquake in Chiang Rai province,
northern Thailand Monday, May 5, 2014. (AP Photo)

Workers look on from the ground after evacuating from a building following an earthquake in Chiang Mai province, northern Thailand Monday, May 5, 2014. (AP Photo/Wichai Taprieu)

A woman looks at damaged house following an earthquake in Chiang Rai province, northern Thailand Monday, May 5, 2014. (AP Photo)

Debris fallen from cracked wall of a hotel building is scattered on the ground after an earthquake hit the area in Chiang Rai province, northern Thailand Monday, May 5, 2014. (AP Photo)
Monday, May 5, 2014
Financial Strategist Warns: “Eventually Someone’s Going to Get Stuck Holding This Massive Bomb on Their Hands”

Given the state of affairs around the globe
it’s no surprise that many people are looking for ways to diversify
their wealth into crisis investments. Navigating through the oft
manipulated economic and financial numbers can be a daunting task,
especially because the world’s geo-political climate is a powder
keg that’s primed to explode at any time.
What we know is that time is not on our
side. What we don’t know is when the pin will finally get
pulled and exactly how events will unfold once it happens.
In
an effort to help us guide our outlook and understand the various
levels upon which the global chess game is being played we often turn
to Marin Katusa, Chief Financial Strategist at the well known
research and advisory firm of Casey
Research. As
Marin notes, there is a lot of risk out there right now, and most
people don’t see it.
History is replete with examples of people who
ignored the early warning signs and bought into the hype, only to be
left holding the bag when those on the inside track exited ahead of
the collapse. Today is no different and there is no shortage of fools
waiting to be parted from their money. Don’t be one of them.
Doug
and I are firm believers that you’re either a contrarian or you’re
a victim… it’s important to understand your own risks and your
own time frame of investment… so that’s the first thing.
Don’t
miss the following interview from Future
Money Trends,
where Marin explores a wide range of strategies designed to
protect your wealth and well
being.
Right
now there are millions of people looking at their stock portfolios,
401k’s, and IRA’s with a huge smile on their faces. The Dow Jones is at
all time highs, after all.
What they don’t realize is that
they are likely invested in companies that are priced 100 or 500 times
their actual earnings. It’s a huge risk that has backfired more times
than we care to count.Look at the
evaluations, utilities for example. We just published a report in our
Energy Report saying what stocks to stay away from. Where a railway is
getting 100 times earnings, a railway. That makes absolutely no sense,
but it pays a 4% yield, it’s pretty safe. So people are over-paying by
five times, I would argue even six times, for a 4% yield.That’s how desperate investors are for yield.But eventually someone’s going to get stuck holding this massive bomb on their hands.
So I have to urge all viewers,
as I’ve been doing to my subscribers, to be very careful, have trailing
stops, and we’ve had an unbelievable market here…The key is to take profits, reduce your risks, mitigate your risks.Whether your personal approach
to preparing for the coming calamity involves structuring your
investments in a well diversified global stock portfolio or focuses more
on a ‘preparedness pantry’ portfolio, the information Marin shares is
key to understanding what investments to avoid, how to find the diamonds
in the rough, and ways to insulate yourself against any number of
worst-case scenarios.The important thing is, as
Marin notes, to mitigate your risk. That means watching and
understanding the complexities of the global economy, financial markets
and investment capital flows, all of which are an essential aspect of
the geo-political climate.If, for example, Russia and
China stop investing in America’s debt then we may see the dollar
collapse. They may simultaneously implement trade restrictions and hold
on to their natural resources like oil, gas, uranium and gold. The
obvious effect would be a massive spike in not only those resources, but
other commodities like food which will skyrocket in tandem.It is for this reason that trend strategists like Marin Katusa and Doug Casey are accumulating crisis investments such Brazil Resources,
precious metals, productive land, and a host of other assets being
ignored by the majority of investors who find their “tips” via their
favorite mainstream TV channel.The way to invest in these
“crisis assets” depends on your means, capabilities and current
portfolio. For some, especially those who have existing stock
investments tied to retirement accounts, your choices are limited to
either withdrawing your money with heavy penalties or positioning your
holdings in advance in such a way that they will benefit when everything
else goes under. For others, who shy away from stocks, bonds and
currencies, looking to physical assets in these same sectors – food,
energy, precious metals – will have similar results.The strategy to implement now
is to avoid what’s hot at the company water cooler and invest in assets
that will be worth something after this economic bomb detonates.Please Spread The Word And Share This Post
The Number Of Working Age Americans Without A Job Has Risen By 27 MILLION Since 2000

Did
you know that there are nearly102
millionworking
age Americans that do not have a job right now? And 20
percent of
all families in the United States do not have a
single member that
is employed. So how in the world can the government claim that
the unemployment rate has “dropped” to “6.3 percent”?
Well, it all comes down to how you define who is “unemployed”.
For example, last month the government moved another 988,000
Americans into
the “not in the labor force” category. According to the
government, at this moment there are 9.75
million Americans that
are “unemployed” and there are 92.02
million Americans that
are “not in the labor force” for a grand total of 101.77 million
working age Americans that do not have a job. Back in April
2000, only 5.48 million Americans were unemployed and only 69.27
million Americans were “not in the labor force” for a grand total
of 74.75 million Americans without a job. That means that the
number of working age Americans without a job has risen by 27
million since
the year 2000. Any way that you want to slice that, it is bad
news.
Well, what about as a percentage of the
population?
Has the percentage of working age Americans
that have a job been increasing or decreasing?
As you can see from the chart posted below, the
percentage of working age Americans with a job has been in a
long-term downward trend. As the year 2000 began, we were
sitting at 64.6 percent. By the time the great financial crisis
of 2008 struck, we were hovering around 63 percent. During the
last recession, we fell dramatically to under 59 percent and we have
stayed there ever since…
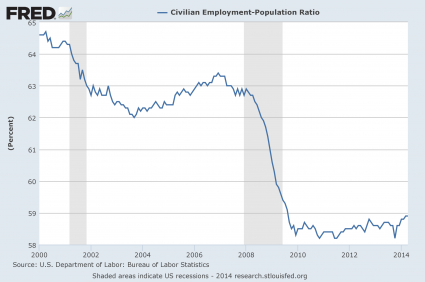
In March, 58.9 percent of all working age
Americans had a job.
In April, 58.9 percent of all working age
Americans had a job.
Things are not getting worse (at least for the
moment), but things are also definitely not getting better.
The
month that Barack Obama entered the White House, we were in the midst
of the worst economic downturn since the Great Depression and
only60.6
percent of
all working age Americans had a job.
Since
only 58.9
percent of
all working age Americans have a job now, that means that the
employment situation in America is still significantly worse than it
was the day Barack Obama took office.
So don’t let anyone fool you with talk of an
“employment recovery”. It simply is not happening.
The official unemployment rate bears so little relation to economic
reality at this point that it has essentially become meaningless.
Look,
how in the world can we have an “unemployment rate” of just “6.3
percent” when 20
percent of all American families do
n0t have a single member that is working?
A family, as defined by the BLS, is a group of
two or more people who live together and who are related by birth,
adoption or marriage. In 2013, there were 80,445,000 families in the
United States and in 16,127,000—or 20 percent–no one had a job.
So if one out of every five families is
completely unemployed, then why is the official government
unemployment rate not up at Great Depression era levels?
Could it be that the government is manipulating
the numbers to make them look much better than they actually are?
Why don’t they just go ahead and get it over
with? They can just define every American that is not working
as “not in the labor force” and then we can have “0.0 percent
unemployment”. Then we can all have a giant party and
celebrate how wonderful the U.S. economy is.
And
don’t be fooled by the “288,000 jobs” that were added to the
U.S. economy last month. For workers under the age of 55, the
number of jobs actually dropped by
a whopping 259,000.
If
we were using honest numbers, the official unemployment rate would
look a lot scarier. John Williams of shadowstats.com
has calculated that the unemployment rate should be about
23 percent.
I don’t think that is too far off.
Meanwhile,
the quality of the jobs in our economy continues to go down.
The House Ways and Means Committee says that
seven out of every eight jobs that
have been “added” to the economy under Barack Obama have been
part-time jobs. But you can’t raise a family or plan a career
around a part-time job. To be honest, it is very hard for a
single person to even survive on a part-time wage in this economic
environment.
As
the quality of our jobs goes down, so do our incomes. The
median household income has
declined for five years in a row,
and the middle class is falling apart.
Without
middle class incomes, you can’t have a middle class.
Considering what we have been watching happen, it should be no
surprise that the homeownership rate in the United States has dropped
to the lowest levelin
19 years or
that the number of Americans receiving money from the government each
month exceeds the number of full-time workers in the private
sector by
more than 60 million.
For
many more statistics like this, please see my previous article
entitled “17
Facts To Show To Anyone That Believes That The U.S. Economy Is Just
Fine“.
At a gut level, most Americans understand that
things are much worse than they used to be.
The Pew Research Center recently asked people
what “class” they consider themselves to be. The results
were shocking.
Back in 2008, only 25 percent of all Americans
considered themselves to be “lower middle class” or “poor”.
We are in the midst of a long-term economic
decline, and no amount of propaganda is going to change that.
But based on the “happy numbers” being
trumpeted by the mainstream media, the Federal Reserve is slowly
bringing their quantitative easing program to an end.
When quantitative easing is finally totally cut
off, we shall see how the financial markets and the U.S. economy
perform without artificial life support.
Personally, I don’t think that it is going to
be pretty.
Implosion Of Housing Bubble 2 Hits Six Cities In The West
Wolf
Richter www.testosteronepit.com www.amazon.com/author/wolfrichter
“Homes
in more than 1,000 cities and towns nationwide either already are, or
soon will be, more expensive than ever,” Zillow reported
gleefully the other day. “National home values have climbed
year-over-year for 21 consecutive months, a steady march upward….”
Glorious recovery. Our phenomenal housing
bubble that, when it blew up spectacularly, helped topple our
financial system, threw the economy into the Great Recession, caused
millions of jobs to evaporate, and made people swear up and down:
never-ever again another housing bubble.
Steps in the Fed, and trillions of dollars get
printed and handed to Wall Street, and asset prices become airborne,
and Wall Street jumps into the housing market and buys up hundreds of
thousands of vacant single-family homes, drives up prices, and armed
with free money, shoves aside first-time buyers and others who would
actually live in these homes, and turned them instead into rental
units. Now in over 1,000 cities, prices are, or soon will be, as high
as they were at the peak of the last housing bubble.
The difference? Last time, all that craziness
was called a “bubble” with hindsight. This time, it’s called a
“housing recovery.”
The
result of this, as Zillow called it, “remarkable milestone”: real
buyers who intend to live in these homes are falling by the wayside.
Every week for months, mortgages to purchase homes have been between
10% and 15% below the same week in the prior year. In the latest
week, they dropped
21%,
the worst week I remember seeing. The number of refis has plunged
even more, but that only ate into bank income statements and caused
thousands of people to get laid off. Purchase mortgages, when they
drop, decimate home sales.
Real
Americans, rather than Wall Street, have been priced out of the
housing market. Inflation has eaten into their wages. Many people can
only find part-time work. Mortgage interest has risen from
ridiculously low to just historically low [ Hot
Air Hisses Out Of Housing Bubble 2.0: Even Two Middle-Class Incomes
Aren’t Enough Anymore To Buy A Median Home].
So
the rate of homeownership in the first quarter, after ticking up last
year and triggering bouts of false hope, fell to 64.8%. The lowest
level since 1995! It had peaked in Q2 2004 at 69.2%, a sign that even
as the prior housing bubble was gaining steam, regular folks
werealready priced
out of the market. This ugly trajectory is the face of the “housing
recovery” sans Wall Street:

And
now history has become a Fed-induced rerun. It started in six until
recently white-hot housing markets in Arizona and California –
Phoenix, Ventura, Riverside, L.A., Sacramento, and San Diego –
where home prices have skyrocketed to the point where few people can
afford them. Electronic real-estate broker Redfin, which covers 19
metro areas around the country, explained the impact of “the double
whammy” – rising prices and mortgage rates –this
way:
Someone who purchased a $350,000 home in
Riverside in March 2013 with a 20 percent down payment and a 30-year
fixed rate of 3.4% would have a monthly mortgage payment of $1,241.
But with prices up 19.6%, the same home would now cost $418,600. At
the current mortgage rate of 4.33%, the monthly mortgage payment on
that home is now $1,663, a 34% jump from a year ago.
And even a year ago, a family with two median
incomes had to stretch to buy that house. Now, in these six markets,
sales are plunging and inventories of houses for sale are soaring. A
deadly mix.
In
Phoenix, inventories were up 42.7% in March from prior year, but
sales were down 17.4%. So sellers slashed prices to get rid of these
homes. In Phoenix, the hardest hit of the bunch, 45% of the sellers
cut their prices. That’s how it starts. Haven’t we been there
before? For instance, at the beginning of the prior housing-bubble
implosion? This is what that debacle
looks like:

It didn’t look quite this terrible in 11 of
the other markets that Redfin tracks: Austin, Baltimore, Boston,
Chicago, Long Island, Philadelphia, Portland, San Francisco, San
Jose, Seattle, and Washington, D.C. (due to “data anomalies,”
Denver and Las Vegas were not included). Sales were still down, but
so were inventories. When the last housing bubble imploded, it didn’t
happen all at once across the country. In some cities, home prices
peaked in early 2006; in San Francisco, they peaked in November 2007.
And what happened to the Wall Street investors
who whipped the market into frenzy by deploying the Fed’s free
money? Soaring prices are “eroding investor profit potential,”
Redfin points out, and many have pulled back. As of year-end 2013,
the percentage of investor purchases in these six markets dropped to
10.6% from 15.6% a year earlier. And since then, they’ve dropped
even more. Easy come, easy go.

“Housing
affordability is really taking a bite out of the market,” is how
the chief economist for the California Association of Realtors
explained the March home sales fiasco. “We haven’t seen this
issue since 2007.” And so, the benchmarks established during the
terrible implosion of the prior housing bubble are suddenly
reappearing. Read…. Housing
Bubble 2.0 Veers Elegantly Toward Housing Bust 2.0
David Quintieri This system of fraud will collapse
David Quintieri of The Money GPS joins me on the Prepper Recon Podcast today to give us an economics update. We talk about the misleading numbers and the fraud that will eventually collapse the global financial system.
Subscribe to:
Posts (Atom)