Los Angeles and negative equity
Negative equity is the number one predictor for future foreclosure. The discussion of underwater homeowners has largely been pushed aside because the housing market has been on a tear upwards for the last year or so. Yet we still have a very high number of people in negative equity positions. Let us take a look at Los Angeles County for the number of distressed homeowners with LTV ratios higher than 100 percent:
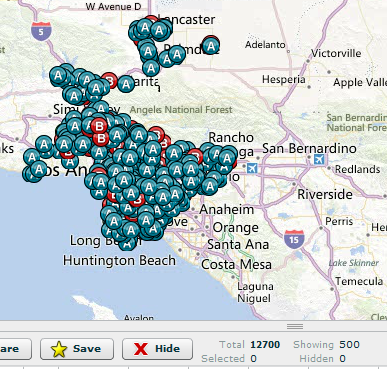
I really like this new tool by ForeclosureRadar. We went ahead and searched for properties where LTV is higher than 100 percent and that were in some stage of foreclosure (i.e., NOD, auction schedule, bank owned). For Los Angeles County 12,700 properties hit this criteria. Is this a lot? Given that the MLS only has 13,900 homes listed for Los Angeles County, this is a massive number and keep in mind this data is up to date and factors in the boom of the last year where property values have surged.
Based on the last month of sales data for Los Angeles, there is only 2.6 months of inventory. That is incredibly low. Normal markets typically carry 6 months of available inventory. Yet we have discussed the trend of the last two years where available inventory for sales has virtually disappeared. The fact that many are still underwater even in SoCal where many properties are selling at or above their peak bubble prices demonstrates the kind of leverage people took on. I should add that many first time buyers are diving into major leverage via FHA insured loans just to have a chance to compete against the all-cash investor pool. Even with that, many agents are preferring to work with all cash-buyers since the escrow close is clean and quick. Sorry regular buyers, you are now last in line in the hierarchy of home buying.
One of the more telling figures regarding what people are able to afford is the figures on the typical monthly mortgage payment taken by buyers. What we find is that buyers are very constrained when it comes to their monthly nut but lower rates have added a deeper level of leverage and of course the incredibly high number of all cash buying (in SoCal it was up to 34 percent last month). Take a look at the typical mortgage payment taken by those with an actual mortgage:
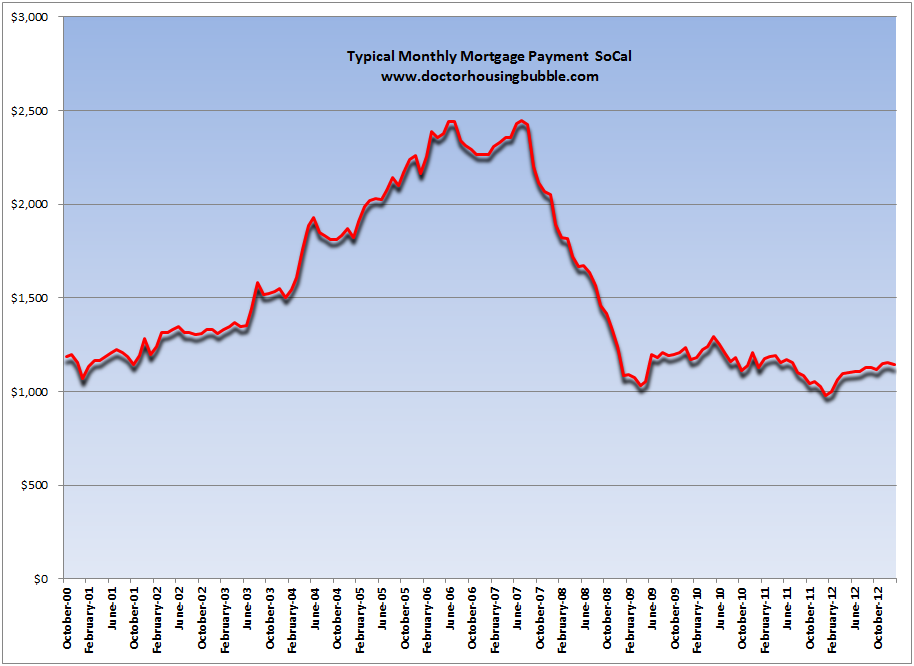
The typical mortgage payment is at decade lows. As we have seen from forums and the current mania, SoCal households are willing to leverage every cent they have into housing just to squeeze in. The above chart gives you a clear picture of what people are able to afford. Which of course makes sense, since household incomes have been stagnant for over a decade.
The LTV data is interesting but with low inventory and investors still out there in droves, we can expect more of the same in the short-term.
No comments:
Post a Comment