Monday, January 11, 2016

Signs Of Market Breakdown: China Stocks, US Margin Debt And Failure Of S&P 500 Support At 1990

China Matters

Over the past few days I have repeatedly heard the following statement:
“China isn’t that important as it is only 7% of the U.S. economy.”
While that may be a true statement in relation to the economy, it is a far different matter when it comes to the financial markets.
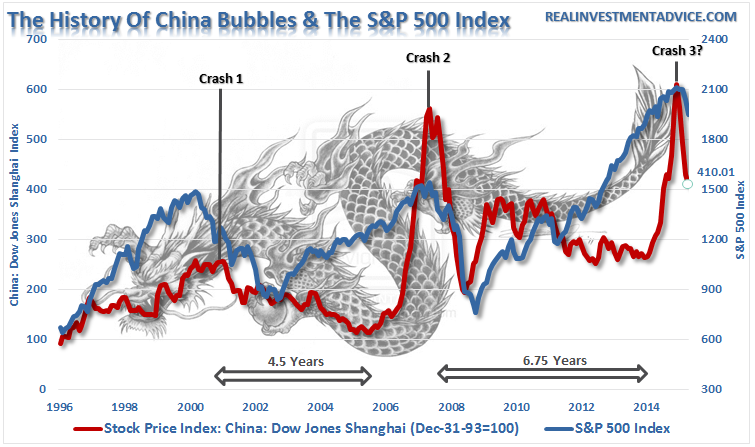
With financial markets so closely correlated, what happens in China has a direct and immediate impact on U.S. markets. Beginning in 2014, China financial markets went parabolic as investors levered up to speculate. This is not the first time this happened, and is a sharp reminder of why the perils of leverage should not be readily dismissed.
The problem is, as shown in the chart below, that what happens in China is not isolated just to China. As money flees those markets, it also rapidly exits the U.S. markets as fears of contagion spread.
China-SP500-010706
While the Chinese government has injected liquidity, suspended trading in almost half of the listed equities and encouraged pension funds to buy securities, arrested short-sellers and “disappeared” corporate executives, these actions have done little to stem the decline as investors “panic sell” in a rush to safety.
That collapse, if history is any guide, is likely not done as yet which suggests that the financial rout in other markets are only just beginning.

Speaking Of Margin

Last year, margin debt in China reached $264 Billion. After adjusting for the size of the two markets, is about double that of the roughly $500 billion in margin debt in the U.S.
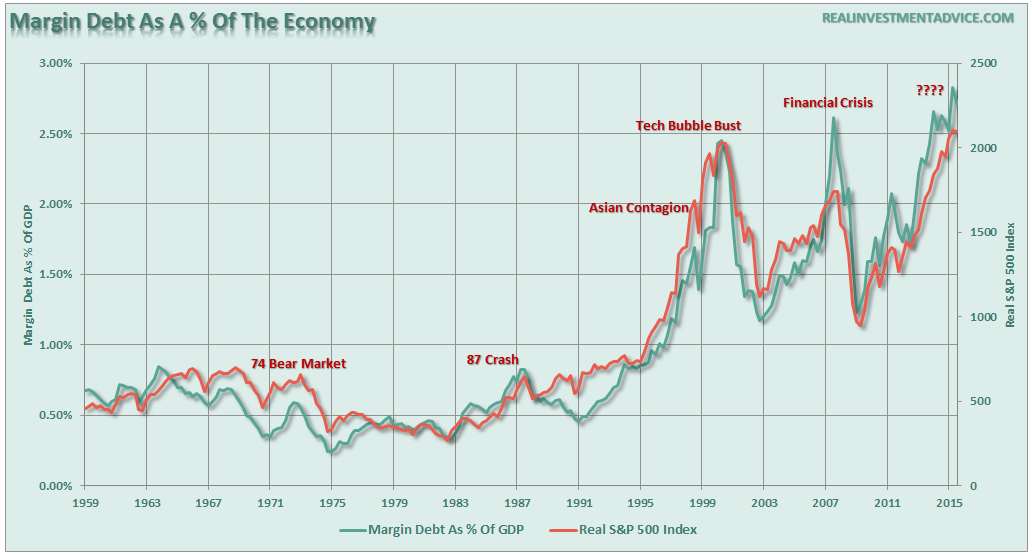
This difference in relative size was given as a prime example about how margin debt is not a problem for the U.S. This is incorrect, and just another example of the MSM’s willful blindness to the facts. The fact is that the relative size of margin debt in the past has not been a “safety net” that investors should rely on. As shown, the level of real (inflation-adjusted)margin debt as a percentage of real GDP has reached levels only witnessed at the peaks of the last two financial bubble peaks in the U.S.
Margin-Debt-GDP-010716
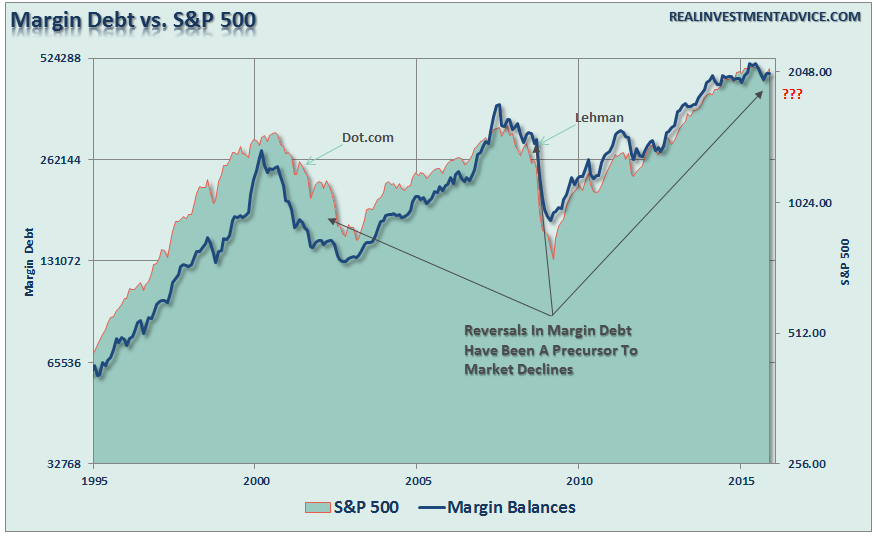
The same is seen in the raw levels of margin debt with respect to the financial markets.
Margin-Debt-010716
While no single indicator should be relied upon as a measure to manage a portfolio, it should be well understood by now that leverage is a “double-edged sword.” While rising margin debt levels provide the additional liquidity to drive stock prices higher on the way up, it also cuts just as deeply when prices fall.
China is clearly showing the consequences of the unwinding of leverage. Despite government actions to stem the decline, investors are finding ways to extract their capital back out of the market in fears of a repeat of the 2008 crash. It is a lesson that should be studied and learned, again, by investors today.
Just as the Federal Reserve encouraged investors to jump into the financial markets by providing liquidity and suppressing interest rates, China also encouraged their population to do the same. Instead of taking actions to control the rise, they (both the U.S. and China) encouraged it. The problem is that when the “bubble” pops – it becomes uncontrollable.
As investors, it is our job to analyze the data and understand the inter-relationships between various data points and our portfolios. While margin debt is but only one “breadcrumb” on the trail, when combined with declining momentum, excessive deviations from long-term means, and weak economic growth, a larger picture of overall “risk” begins to emerge.
Does this mean that investors should “panic sell” immediately and run into the safety of cash? No. However, it does suggest that investors should be much more cautious about portfolio allocations and the degree of risk being undertaken as it relates to long-term investors objectives.

Technical Supports Under Attack

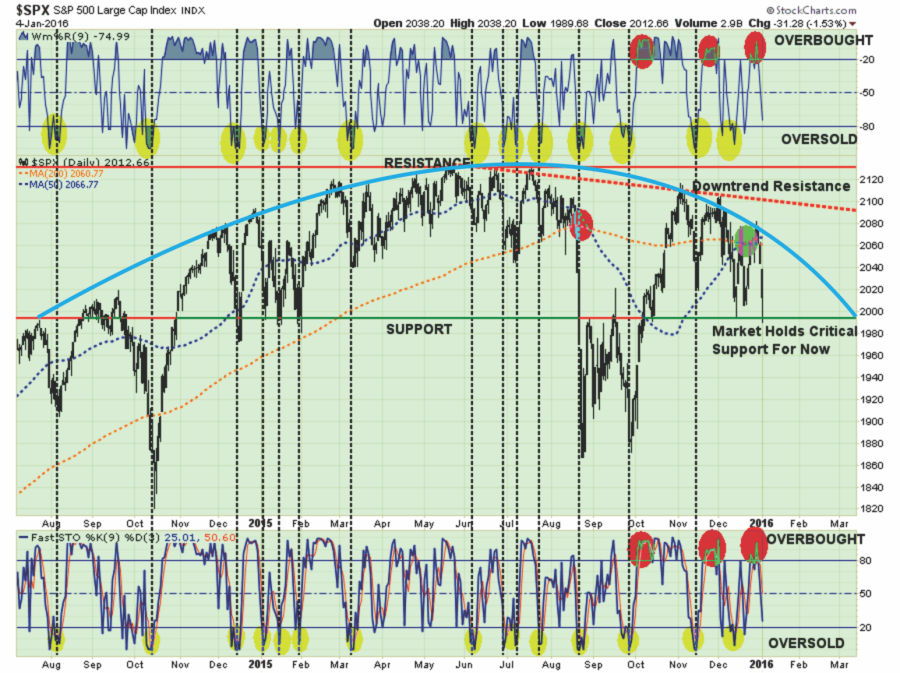
Earlier this week, I discussed the importance for the market to hold support at 1990 on the S&P 500. That level is under critical attack this morning as the market slides over concerns of China.
“Importantly, the ongoing topping process continues in earnest. As shown in the two charts below, the current topping process is very akin to the processes witnessed at the previous two major market peaks in 2000 and 2007.
You can clearly see the topping process being made over the last 18 months in the market. Until, or unless, the market can break out of the current downward trend, the risk of lower asset prices remains elevated.”
SP500-MarketUpdate-010516-3
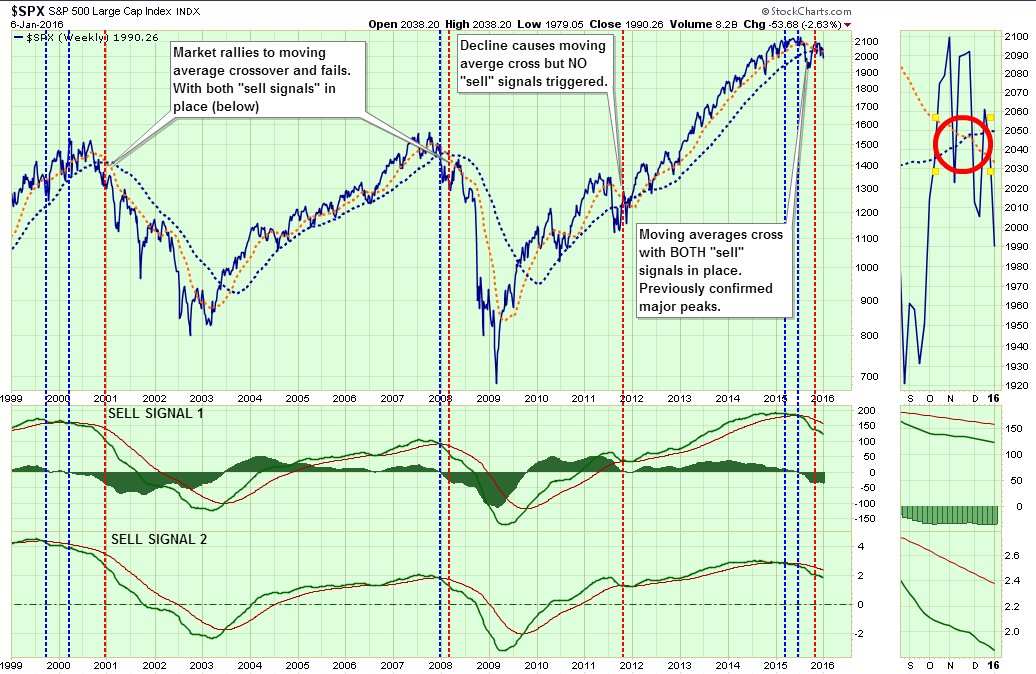
More importantly, if we step back to a “weekly” view of the markets we get a better picture of the level of deterioration currently in progress. As shown in the chart below, not only have both lower sell signals been triggered by deterioration in price momentum, the short and long-term moving averages have now crossed.
SP500-MarketUpdate-010716-2
Since the turn of the century, the two primary moving averages have only crossed three other times – at the peak of the markets in 2001 and early 2008, and in 2011. The difference in 2011 is that while the sharp decline in the prices due to the debt ceiling debate caused the moving averages to cross, the two lower sell signals were not triggered. This kept portfolios allocated more towards equities at that time.
The current topping process, as discussed on Tuesday, is more akin to that seen in 2000 and early 2008. With primary moving averages now crossed, sell signals in place and markets trading below supports, rallies in equities should be used to rebalance portfolios and reduce risk. 
While the markets are not “technically” in a “bear market” currently, it is important to remember that they weren’t in 2001 and early 2008 either.Waiting to make adjustments until after full recognition of the event doesn’t leave you many options.
Just some things to think about.
Lance Roberts
lance_sig
Lance Roberts is a Chief Portfolio Strategist/Economist for Clarity Financial. He is also the host of “The Lance Roberts Show” and Chief Editor of the “Real Investment Advice” website and author of “Real Investment Daily” blog and “Real Investment Report“. Follow Lance on Facebook, Twitter, and Linked-In

Thursday, December 31, 2015

Happy New Year — Bail-In Passed for Europe’s Banks

ECB
The mainstream media is not extensively reporting on the “experimental” bail-in that the EU imposed on Cyrus. The bail-in, that they swore would never be applied to Europe, will officially begin in January. This new power will be in the interest of taxpayers as they will no longer be forced to pay for failed banks that were created by the childish structure of the euro that was created by lawyers who never understood the economy. But wait a minute — aren’t taxpayers the people with deposits in banks? Hm. Moving to electronic money is also about preventing bank runs. The bottom-line here is that they will just take your money to save bankers. Eliminating cash accomplishes two things: (1) they get to tax everything, and (2) you cannot withdraw money from banks.
The bail-in directive was agreed upon on January 1, 2015, and the bail-in system will take effect on January 1, 2016. So here we are, just in case you missed this one. Their website states:
Parliament and Council Presidency negotiators reached a political agreement Wednesday on the draft bank recovery and resolution directive, the first step towards setting up an EU system to deal with struggling banks. This directive will introduce the “bail-in” principle by January 2016, thereby ensuring that taxpayers will not be first in line to pay for bank failures.
The entire system of insuring banks after their collapse during the Great Depression was to restore confidence to end the hoarding and revitalize the economy. Now they have allowed bankers to do everything they did before, and they have reversed the insurance created to restore confidence in banking. They justify this by claiming taxpayers will not have to pay for the failed banks.
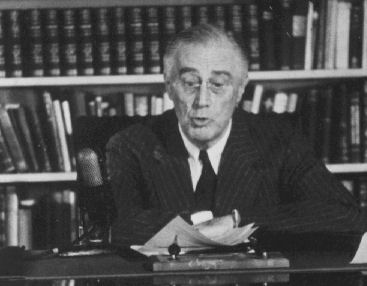
FDR-Fireside Chat
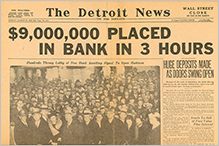
Over 9,000 banks failed during the Great Depression in the United States; an estimated 4,000 banks failed in 1933 alone. Roosevelt’s fifteen-minute radio address to the American people on Sunday evening, March 12, was his first Fireside Chat. He told the public that only sound banks would be licensed to reopen by the U.S. Treasury: “I can assure you that it is safer to keep your money in a reopened bank than under the mattress.”
1933 NYT Bank Holiday
1933 Detroit Money Returned to Banks
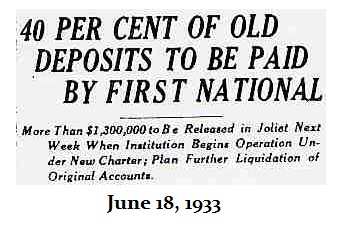
1933 40percent deposite to be paid
When the institutions reopened for business on March 13, 1933, depositors stood in line to return their hoarded cash to neighborhood banks. Within two weeks, Americans had redeposited more than half of the currency that they had withdrawn from the banks due to the collapse in confidence.
Banks failed even after the bank holiday. The process was indeed a “bail-in”. People would get whatever the scraps were worth upon the collapse of the bank. Absolutely everything the governments did to restore confidence has been reversed in Europe. Yet, they try to “stimulate” the economy with QE? Just brain-dead.

Gerald Celente: Existing home sales down 10.5% in November


Gerald Celente: Existing home sales down 10.5% in November
Existing home sales down 10.5% in November, mergers/acquisitions break 2007 peak record & the early release of this week’s Trend This Week! You won’t read this anywhere else!

FINANCIAL REPRESSION POLICIES MIRROR AN ACCELERATING“CRISIS OF TRUST

Since the Dot.com Bubble burst the US has accelerated its Macro-Prudential Policies of Financial Repression. PEW Research just released a study which tracks the deterioration in the confidence citizens have in their government.
We have a Crisis of Trust in America and as the charts below show, it has only accelerated with government policies of Financial Repression.
Just 19% of Americans say they “can trust the federal government always or most of the time”. 
  • That’s among the lowest levels in over 50 years.
  • The long-term erosion of public trust is mirrored by a steep decline in the belief that the government is run for the benefit of all Americans.


Less than a year ahead of the presidential election, there is widespread discontent with the federal government. A new Pew Research Center report finds deep distrust in government and considerable cynicism about politics and elected officials alike. But despite these negative assessments, majorities believe government does a good job on many issues and want it to have a major role on a wide range of policy areas.
Here are five of PEW’s key takeaways from the report:
1 The public’s trust in government remains at historic lows. Today, just 19% say they trust the federal government to do what is right always or most of the time, which is little changed from recent years. Fewer than three-in-ten Americans have expressed trust in government in every major national poll conducted since July 2007 – the longest period of low trust in government seen in more than 50 years.
While Democrats are more likely than Republicans to say they trust the government, trust remains low across partisan lines: Just 11% of Republicans and Republican-leaning independents say they trust the government, compared with 26% of Democrats and Democratic leaners. (For more on the public’s trust in government, see this interactive.)
2 As in the past, the public’s feelings about government run more toward frustration than anger. Currently, 57% are frustrated with the federal government; 22% are angry, while 18% are basically content.
Far more Republicans (32%) than Democrats (12%) say they are angry with the government. But higher shares in both parties expressed anger toward government in October 2013, during the partial government shutdown.
While anger at government has been higher among Republicans than Democrats during Barack Obama’s administration, the situation was reversed during George W. Bush’s presidency: In October 2006, 29% of Democrats said they were angry with government, compared with just 9% of Republicans.
3 Despite their widespread cynicism, most Americans give government good ratings in a number of areas. Half or more say the federal government is doing a “very good” or “somewhat good” job in 10 of the 13 governmental functions tested in the survey.
However, the federal government receives particularly low marks in two key areas: Managing the nation’s immigration system and helping people get out of poverty. Nearly seven-in-ten (68%) say the government does a very or somewhat bad job in managing the immigration system; just 28% say it is doing a good job. Ratings are nearly as negative when it comes to the federal government’s efforts to help people get out of poverty: 61% say the government is doing a bad job in this area, while 36% give it a positive assessment.
Majorities say the government should have a major role in dealing with 12 of 13 issues included in the survey.
4 Americans are harshly critical of elected officials. The public views politicians as more selfish and considerably less honest than ordinary Americans. Just 29% say that “honest” describes elected officials very or fairly well, a much smaller share than those who describe the average American as honest (69%).
Most people do say the term “intelligent” describes elected officials very or fairly well (67%). However, just as many view the typical American as intelligent. And when asked if elected officials or ordinary Americans could do a better job of solving the nation’s problems, 55% say ordinary Americans could do better.
While negative opinions of politicians are not new, the perception that elected officials don’t care about what people think is now held more widely than it has been in recent years. Today, 74% say this, compared with a narrower 55% majority who said the same in 2000.
5 Congress is not the only institution the public sees as having a negative influence on how things are going in the country today. Majorities see the national news media (65%) and the entertainment industry (56%) as having a negative impact on the country. By contrast, overwhelming majorities see small businesses (82%) and technology companies (71%) as having a positive impact.
There are substantial partisan and ideological divides in the views of several of these institutions. For example, nearly seven-in-ten liberal Democrats (69%) say colleges and universities have a positive impact on the country, compared with just less than half (48%) of conservative Republicans. Conversely, fully three-quarters of conservative Republicans say that churches and religious organizations have a positive impact on the country, while just 41% of liberal Democrats agree.
The Thompson-Reuters TRust Index of confidence in the top 50 Global Financial Institutions shows an also very worrying trend deterioration!

CRISIS OF TRUST
As we laid out in the 2013 Thesis Paper “Statism“, a Crisis of Trust has a profound impact on the economy and if left unresolved politically for a protracted period will lead to economic stagnation.
In last year’s 2015 Thesis Paper: “Fiduciary Failure” we spelled out the crippling level it has now reached in the US. It has only gotten worse and we detail in the 2016 Thesis Paper: Crisis of Trust in The Era of Uncertainty how it is now infecting the global economy.
Sign-up now for your 2016 Thesis Paper: Crisis of Trust in The Era of Uncertainty

Honey, I Shrunk the Middle Class: Perhaps 1/3 of Households Qualify

If it takes more than $126,000 to fund a qualitatively defined middle-class lifestyle, what sense does it even make to call this “middle”?

The Pew Research Center’s recent report The American Middle Class Is Losing Ground: No longer the majority and falling behind financially made a media splash, as it reported that less than 50% of adults are members of the Great American Middle Class.


My analysis suggests that by more qualitative measures, no more than a third of U.S. households qualify as middle class: claiming 49% of the nation’s households are still middle class is a gross exaggeration.

My analysis starts with the minimum fundamental lifestyle and wealth requirements of middle-class membership: In What Does It Take To Be Middle Class?, I listed these requirements:

1. Meaningful healthcare insurance ($5,000 deductible healthcare plans don’t qualify; they are simulacrum/phantom coverage).
2. Significant equity (25%+) in a home or other real estate.
3. Income/expenses that enable the household to save at least 6% of its income.
4. Significant retirement funds: 401Ks, IRAs, etc.
5. The ability to service all expenses over the medium-term if one of the primary household wage-earners lose their job.
6. Reliable vehicles for each wage-earner.
7. The household does not depend on government assistance to maintain the family lifestyle.
8. A percentage of hard assets beyond the family home that can be transferred to the next generation.
9. Surplus income to invest in children (extracurricular activities, lessons, etc.).
10. Leisure time devoted to the maintenance of physical/spiritual/mental fitness.
In other words, middle class cannot be meaningfully defined by income alone.The middle class is more than owning a home (especially if the equity is modest or dependent on the asset bubble du jour): the most fundamental qualities of the middle class are not measures of income or bling, though obviously income is necessary to provide them:

— real healthcare coverage
— wealth that can’t be destroyed by one bad break or one popped asset bubble

— the ability (and willingness) to invest in children

— the ability (and willingness) to transfer accumulated real wealth to the next generation.

Income is not an accurate proxy, as many high-income households are living paycheck to paycheck: regardless of their income, they don’t qualify as middle class by qualitative standards.

Read the Whole Article

THE HERD IS HEADING FOR A CLIFF: NOW IS THE TIME TO REGAIN YOUR SENSES AND STOP PLAYING IN THIS RIGGED WALL STREET GAME.

by James Quinn 

You would think investors (muppets) would be grateful for the extended topping process of the stock market, as it has given them the opportunity to exit before the inevitable crash. As CNBC and the rest of the mainstream media spin bullish stories to keep the few remaining mom and pop investors sedated and the millions of passive working Americans invested in their 401ks, the Wall Street rigging machine siphons off billions in ill-gotten gains, while absconding with fees for worthless advice.
Does the average schmuck know the S&P 500 stood at 2,063 on November 21, 2014 and currently sits at 2,056, thirteen months later? Based on the media narrative, we are still in the midst of a raging bull market. John Hussman provides the counterpoint to this narrative with unequivocal factual evidence based upon a hundred years of stock market data and valuations. Anyone investing in today’s market should expect ZERO returns over the next ten years and a 40% to 55% plunge in the near future. And as a cherry on top, a recession has arrived.
The summary of this outlook is straightforward. I view the equity market as being in the late-stage top formation of the third financial bubble in 15 years. Based on a century of evidence relating the most historically reliable valuation measures to actual subsequent market returns, neither a market plunge of 40-55% over the completion of the current cycle, nor the expectation of zero 10-12 year S&P 500 nominal total returns, nor the likelihood of substantially negative 10-12 year real returns should be viewed as worst-case scenarios – they are all actually run-of-the-mill expectations from current extremes. Based on the joint behavior of the most reliable leading economic measures (particularly new orders plus order backlogs, minus inventories), widening credit spreads, and clearly deteriorating market internals, our economic outlook has also moved to a guarded expectation of a U.S. recession.
The Federal Reserve has encouraged the rampant speculation over the last few years with their trillions in QE gift to Wall Street banks and ZIRP, which allowed the “brilliant” 30 year old Ivy League educated high frequency traders to take the free Fed money and front run their client’s trades and generate guaranteed profits. Of course, ZIRP also forced grandmas throughout the country to acquire a taste for cat food in order to survive. But Ben and Janet are “heroes”, I’m told. What a coincidence that shortly after the QE spigot was turned off on October 29, 2014, the market has gone nowhere. The speculative juices appear to be drying up.
Because speculation tends to be indiscriminate, the most reliable measure of a robust willingness to speculate is the uniformity of market action across a broad range of individual stocks and security types. An overvalued market populated with speculators who still have the bit in their teeth will tend to hold up or advance further despite valuation extremes. Because of the Federal Reserve’s relentless and intentional encouragement of speculation in the half-cycle since 2009, even measures of overvalued, overbought, overbullish extremes – which had historically been followed almost invariably by market collapses in prior market cycles – were followed instead by further market advances.
John Hussman, inconveniently for those of a bullish ilk, notes that market internals have deteriorated rapidly, with only a few beloved, overvalued, overhyped tech stocks holding up the market. Most stocks are already in a bear market. Corporate profits are falling. PE ratios are high. Consumer spending is anemic. The jobs growth narrative is false. Real household income is at 1989 levels. Based on history, current conditions have only been seen at major tops. I’m sure this time will be different and Cramer, along with all the highly paid Wall Street shills, will be right.
Now that market internals have clearly deteriorated following overvalued, overbought, overbullish extremes, with reliable valuation measures at obscene levels and emerging economic weakness, a century of history suggests that the stock market is vulnerable to the risk of severe losses. Investors should not assume that the “support” that keeps losses relatively shallow during a drawn-out topping process will persist. There’s some truth in the old saying “the bigger the top, the steeper the drop.” Only a few points in history have seen the S&P 500 within 3% of a record high, with both overvaluation and unfavorable market internals during at least 80% of the prior 26-week period. Aside from points in recent months, the other points were major tops in 2007, 2000, 1972, 1969, and 1961.
When you talk to your relatives, neighbors and coworkers they all act like they are buy and hold long term investors. They are either lying or oblivious. Someone who is 60 years old and has accumulated a significant 401k nest egg invested in stocks can not afford a 50% haircut in their retirement portfolio. Anyone with a significant amount in the stock market will have to have balls of steel to not panic as their life savings is cut in half – AGAIN. Three times in fifteen years is pretty hard to swallow. The debt markets (junk bonds) are a flashing red warning light. To not heed the warnings of the market would be foolish. Hussman couldn’t be any clearer, just as he was in 2000 and 2007.
I really do implore investors who could not comfortably ride out a market collapse similar to 2000-2002 or 2007-2009, or who rely on their assets to finance near-term spending plans, to shift their risk exposure down to a level that could tolerate that outcome. Understand that while valuations have been hostile for years, and while overvalued, overbought, overbullish conditions have repeatedly emerged in the recent half-cycle without effect, the hinge that supported continued gains was a persistent willingness to speculate, as conveyed by uniformly favorable market internals. That support has dropped away. Ignore that key distinction at enormous risk. The market behavior we’ve observed in recent quarters is fully consistent with an extended top formation. With credit spreads predictably widening in successively larger spikes, that formation appears increasingly vulnerable to a steep vertical break of prior support.
Robert Prechter perceptively notes that investors act in a herd like manner thinking that because the herd is still invested in the market and has not sensed danger yet, it must be safe. Investors are lazing around the waterhole like unsuspecting gazelles. This herd will be running for their lives in the near future, as danger is lurking.

Still, we doubt that most speculators think about the decision to accept market exposure in such a systematic way. On that point, Robert Prechter of EWI offered a brilliant perspective last week to describe the typical behavior of speculators. He observed, “In neither case – buying or selling – is there any thought about taking on risk, rationally or otherwise. In both cases, they are unconsciously acting to reduce risk, thanks to the emotionally satisfying impulse to herd. Herds act to gain sustenance or avoid danger. Gazelles may lope together toward the water hole or dash in a herd from predators. The goal, albeit unconscious, of both types of actions is to reduce risk. Likewise, in market advances speculators herd as if trying to gain sustenance; and in market declines they herd as if trying to avoid getting killed… Subjectively, i.e. in their own minds, speculators perceive greater risk as less risk and less risk as greater risk. That is why they buy in uptrends and sell in downtrends. In the former case, they behave as if the herd is leading them to sustenance, and in the latter case they behave as if the herd is leading them away from danger. Ironically, the truth is wholly the opposite.”
If you have an ounce of common sense, ability to think critically, and appreciation for risk, you should leave the herd now before the inevitable stampede. Staying with the herd as it heads for the cliff is not an effective strategy.
At present, we observe a herd at the peak of a valuation cliff, where an increasing proportion of the herd is backing away. It’s increasingly urgent to dig in one’s hooves to keep from dashing over the edge. We can do little for those who insist on remaining in full gallop, imagining that sustenance awaits them ahead.
After experiencing two Federal Reserve induced booms and busts in the last fifteen years, you would think people would learn. But the true lesson of history is that people never learn from the lesson of history.
How did the S&P 500 trace out a total return of zero between 2000 and the end of 2011? By first losing half its value, then more than doubling, then losing more than half its value, and then doubling again. Across history, extreme valuations have invariably been followed by similar behavior – wide cyclical swings, yet only modest overall returns over the following decade.
Anyone fully invested in the stock market at this point in time is delusional and mad. If they think they can sense danger before the rest of the herd and exit once the stampede starts, they are badly mistaken. Just as they were in 2000 and 2007. Now is the time to regain your senses and stop playing in this rigged Wall Street game.
After years of Fed-induced yield-seeking speculation that has driven equity valuations to the second most extreme point of overvaluation in history (and the single most extreme point on the basis of median valuations), investors have somehow convinced themselves that this time will be different; that this time the market will maintain at a permanently high plateau. That belief is nothing new – it’s the same delusion that investors have held at speculative peaks across history, refusing to accept the familiar signs of danger until the equally familiar losses were conclusively in hand.
“Men, it has been well said, think in herds; it will be seen that they go mad in herds, while they only recover their senses slowly, one by one.”
Charles Mackay, Extraordinary Popular Delusions and the Madness of Crowds
Read Hussman’s Weekly Letter

How Iceland Escaped From The One Bank

by Jeff Nielson
What have the governments of the corrupt Western bloc spent most of their time doing since the Crash of ’08? We can answer this question in three parts:
1)  Creating increasingly falsified “statistics” to fabricate the illusion that their economies were not all on the verge of an all-out economic collapse.
2)  Hacking-and-slashing every social program in sight, in order to generate the false-savings known as Austerity.
3)  Creating new funny-money and taking on new debt at an exponentially increasing rate, in order todelay collapse, since all that Austerity accomplished was to accelerate these death-spirals.
Making these points apparent to newer readers will require additional elaboration. The starting point is the Crash of ’08 itself. What caused these nations to go from being merely heavily indebted to hopelessly insolvent, overnight? That can be summed-up in a single euphemism of fraud and crime: “too big to fail”.
At the end of 2008; the West’s puppet governments succumbed to History’s ultimate act of blackmail, at the hands of History’s largest and most-rapacious crime syndicate: the One Bank. “Give us all your money, or we’ll blow up your entire financial system.” That is the real meaning of too-big-to-fail: institutionalized extortion, in perpetuity.
What was the real price-tag for this massive extortion operation? Forget the phony numbers published by our corrupt governments, and their mouthpieces in the Corporate media. The total quantum for theseextortion payments was in the $10’s of TRILLIONS. Obviously the Deadbeat Debtors of the West couldn’t raise more than a tiny fraction of that amount of blackmail-money up front. Thus most of this shake-down of (supposedly) sovereign governments came in the form of future tax-breaks and “loss guarantees”.
In the Shake-Down of ’08, our governments did not merely clean out every penny they could scrounge from our public Treasuries, and also borrowed every penny that they could. In addition, they mortgaged the future of our children and grandchildren, by pledging infinite corporate welfare for the One Bank.
Western governments had no money left to spend on their own people after committing $10’s of trillions in extortion payments to this banking crime syndicate, while also having to deal with rapidly rising interest payments (to the same crime syndicate) on all their new debts. So Western governments then pulled out their chain-saws, and attacked our social programs.
Infinite dollars in “interest payments” go to the crime syndicate; no pennies are left for the people. That is Austerity. However, so-called Austerity represents more than simply another act of economic treasonagainst Western populations, it is also the fatal, self-inflicted wound for these economies.
Austerity treason took economies which were already in a slow-motion descent toward collapse, and rapidly sped-up that suicide cycle. The evidence here is overwhelming, but can be summed-up most easily in one word: Greece.
Greece has had far greater and more-punitive amounts of Austerity treason heaped upon its victim population than any other regime in the Corrupt West. It was demanded by the economic sadists known as “the Troika”: the European Union, the European Central Bank, and the International Monetary Fund. The result? This nation was bankrupted twice within a span of five years.
Which nations are closest behind Greece in Europe’s Bankruptcy Derby? Spain and Portugal. These are the #2 and #3 nations, in terms of inflicting the greatest amounts of this suicidal Austerity on their own populations. Austerity kills. More Austerity kills faster.


Here people need to understand that it was always totally predictable that Austerity would fail. It was always totally predictable that Austerity would harm these economies more than help them. And this waspredicted (repeatedly) in previous commentaries.
How do you make any economy stronger? The key lies within one of the most fundamental principles of economics: the Marginal Propensity to Consume. This law of economics is universally accepted, because it is ½ simple arithmetic, and ½ common sense.
In elementary terms, the fastest/easiest way to make any economy stronger is to place a dollar into the hands of a member of the Poor or Middle Class. Why? Because these people will spend most of that dollar (the Middle Class), or all of that dollar (the Poor), immediately. This extra dollar of consumption then gets divided up into wages, payments to suppliers, tax revenues for the government, etc. Then additional portions of that dollar are spent and re-spent. This is known as “the multiplier effect”, and it explains why the Marginal Propensity to Consume is a universally accepted principle.
But what happens if we put a dollar into the hands of the Rich, rather than the Poor or Middle Class? By definition; the Rich person will hoard the vast majority of that dollar. As a matter of the simplest logic and arithmetic, no person can become “rich” unless/until they have spent years hoarding wealth, or they win a lottery.
Thus every time a Rich person receives a dollar, most of that dollar is hoarded and disappears from the economy. Only a few pennies of that dollar are ever circulated, and as a result the multiplier effect isvirtually nil. This is known by the economic euphemism: “trickle-down economics”. Put all the new dollars into the hands of the wealthy, and only a few pennies will ever “trickle down” to the economy.
“Trickle-down economics” has been the official policy of nearly all of the traitorous governments of the Corrupt West since the start of the new millennium, and, in the case of the U.S., it goes back at least a full generation. This policy of everything-for-the-Fat-Cats and nothing for the Little People is one of the primary reasons for the relentless decay in our standard of living, and the relentless collapse of our economies.
How do you then make these sick economies even sicker? Start taking extra dollars out of the hands of the Poor and Middle Class — Austerity. Every dollar of Austerity treason creates a Reverse Multiplier Effect: removing more and more dollars from the system, and thus starving the economy of the fuel which allows our consumer economies to survive: consumer spending.
Austerity causes the economy to get even sicker, leading to larger deficits, more borrowing, and thus even higher interest payments to the parasitic One Bank. Debt slavery. The response from these puppet governments to this vicious circle? Even more Austerity. If something fails, do much more of it.
However, one Western nation that was caught up in the original Crash of ’08 did not climb aboard this treadmill of economic suicide and blackmail: Iceland. As a result, alone among the nations of Europe, Iceland enjoys real robust economic growth. The standard of living of its population is once again rising, rather than falling – as it is throughout the rest of the Corrupt West.
How? How did one, small island nation succeed while every other Western government failed, miserably and completely? As with the economic suicide now practiced throughout the Corrupt West, Iceland’s success also traces back to the same, four words: “too big to fail.”
What happened when Iceland’s Big Banks (more tentacles of the One Bank) arrogantly demanded that the government rubber-stamp the principle-of-crime of “too big to fail” – sacrificing the System in order to save the Big Banks? Iceland’s government responded that it had a different, radical idea: it would sacrifice the Big Banks, and save the System.
Iceland’s Big Banks folded. As with all blackmailers, the One Bank responded to Iceland’s refusal to be blackmailed by immediately lashing-out, in revenge. Among other things, it attacked Iceland’s currency (i.e. manipulated it lower), yet another criminal conspiracy for which the Big Banks have now been convicted.
However, Iceland’s government stood firm, and did not cave in to the attempted extortion by this crime syndicate. It weathered the financial/economic reprisals. It proved that “too big to fail” was always nothing more than a lie and a myth, created by the banking crime syndicate. No entity within any system could ever be more important than the system itself. This was always elementary logic. Iceland has validated that logic.
Iceland refused to be blackmailed. Iceland refused to take on the extra debt (and debt slavery) that came with the blackmail. Iceland refused to touch its social programs. Iceland has the strongest economy in the Western world.
Game, set, and match.