Friday, June 14, 2013

Steven Spielberg and George Lucas predict ‘implosion’ of film industry

Steven Spielberg George Lucas
Steven Spielberg on Wednesday predicted an “implosion” in the film industry is inevitable, whereby a half dozen or so $250 million movies flop at the box office and alter the industry forever. What comes next — or even before then — will be price variances at movie theaters, where “you’re gonna have to pay $25 for the next Iron Man, you’re probably only going to have to pay $7 to see Lincoln.” He also said that Lincoln came “this close” to being an HBO movie instead of a theatrical release.
George Lucas agreed that massive changes are afoot, including film exhibition morphing somewhat into a Broadway play model, whereby fewer movies are released, they stay in theaters for a year and ticket prices are much higher. His prediction prompted Spielberg to recall that his 1982 film E.T. the Extra-Terrestrialstayed in theaters for a year and four months.
The two legendary filmmakers, along with CNBC anchor Julia Boorstin and Microsoft president of interactive entertainment business Don Mattrick, were speaking at the University of Southern California as part of the festivities surrounding the official opening of the Interactive Media Building, three stories high and part of the USC School of Cinematic Arts.
Lucas and Spielberg told USC students that they are learning about the industry at an extraordinary time of upheaval, where even proven talents find it difficult to get movies into theaters. Some ideas from young filmmakers “are too fringe-y for the movies,” Spielberg said. “That’s the big danger, and there’s eventually going to be an implosion — or a big meltdown. There’s going to be an implosion where three or four or maybe even a half-dozen megabudget movies are going to go crashing into the ground, and that’s going to change the paradigm.”
Lucas lamented the high cost of marketing movies and the urge to make them for the masses while ignoring niche audiences. He called cable television “much more adventurous” than film nowadays.
“I think eventually the Lincolns will go away and they’re going to be on television,” Lucas said. “As mine almost was,” Spielberg interjected. “This close — ask HBO — this close.”
“We’re talking Lincoln and Red Tails – we barely got them into theaters. You’re talking about Steven Spielberg and George Lucas can’t get their movie into a theater,” Lucas said. “I got more people into Lincoln than you got into Red Tails,” Spielberg joked.
Spielberg added that he had to co-own his own studio in order to get Lincoln into theaters.
“The pathway to get into theaters is really getting smaller and smaller,” Lucas said.
Mattrick and Spielberg also praised Netflix, prompting Boorstin to ask Spielberg if he planned to make original content for the Internet streamer. “I have nothing to announce,” said the director.
Lucas and Spielberg also spoke of vast differences between filmmaking and video games because the latter hasn’t been able to tell stories and make consumers care about the characters. Which isn’t to say the two worlds aren’t connected. Spielberg, in fact, has teamed with Microsoft to make a “TV” show for Xbox 360 based on the game Halo and he is making a movie based on the Electronic Arts game Need for Speed.
Hollywood
Source: http://www.hollywoodreporter.com/news/steven-spielberg-predicts-implosion-film-567604

U.S. Mint June Silver Coin Sales At 4,651,429 Ounces – Record 2013 Likely

by GoldCore
Today’s AM fix was USD 1,386.25, EUR 1,039.71 and GBP 885.33 per ounce.
Yesterday’s AM fix was USD 1,377.25, EUR 1,036.77 and GBP 878.40 per ounce.
Gold climbed $10.00 or 0.73% yesterday to $1,388.70/oz and silver surged to $22.012 and finished up 0.37%.

Silver in USD, 5 Year – (Bloomberg)

Silver continues to perform very poorly and is down 28% year to date to make it one of the worst performing commodities in the world and on track for its worst performance since 1984.
At the end of 2012, investors expected silver to be one of the biggest gainers in 2013, expecting a 33% return, a Bloomberg survey showed. Analysts expected silver to surge because either turmoil would boost demand for precious metals as a protection against inflation and currency debasement or accelerating growth would spur more industrial buying for everything from solar panels to batteries.

Total Known Silver ETF Holdings – (Bloomberg)

Investors are maintaining their belief in silver even as they lose faith in gold. While the amount of silver held through exchange-traded products is little changed this year, and within 5% of the record reached in March, gold holdings dropped 19%, data compiled by Bloomberg show.
Holdings of silver in ETPs rose 1.1 tons this year, compared with a 1,621-ton expansion in 2012, data compiled by Bloomberg show.
Silver investments stand at 18,905.8 metric tons, valued at $13.2 billion and enough to meet global demand for jewelry and silverware for almost three years. The value of gold ETP investments slumped 34% to $94.1 billion this year.
Investors for now are treating silver more like a precious metal than an industrial one, with its 30-week correlation coefficient to gold at 0.85, from 0.68 in 2011. A figure of 1 means the two move in lockstep.
Silver also tumbled into a bear market in April and is 56% below the record $49.8044 reached in April 2011. However, silver is up 63% in the last 5 years of the financial crisis, thereby protecting investors and savers globally from stock market crashes, bail-ins and currency debasement.

Precious Metals & Currency Ranked Returns in South African Rand

Hedge funds and other large speculators have turned bullish again after betting on lower prices as recently as mid-May, U.S. Commodity Futures Trading Commission data show. They are holding a net-long position of 1,230 futures and options, compared with a five-year average of 21,400 contracts.
Industrial demand may gain as the global economy improves, with the International Monetary Fund predicting growth of 3.3 percent this year and 4 percent in 2014, from 3.2 percent in 2012. About 50 percent of silver is used in industry, compared with 10 percent for gold, data from the Silver Institute and London-based World Gold Council show.
Consumption by industrial users will rise 1.7 percent to a three-year high of 14,625 tons this year and gain another 2.8 percent in 2014, Barclays Plc predicts. A car contains as much as 30 grams (1.1 ounces) and a mobile phone as much as 0.25 gram, according to Washington-based Silver Institute data.
The slump spurred demand for physical metal, with the U.S. Mint predicting last week that its gold and silver coin sales may reach a record in 2013.
The Austrian Mint sold about 2 million ounces of silver in April, compared with 8.8 million for all of 2012.


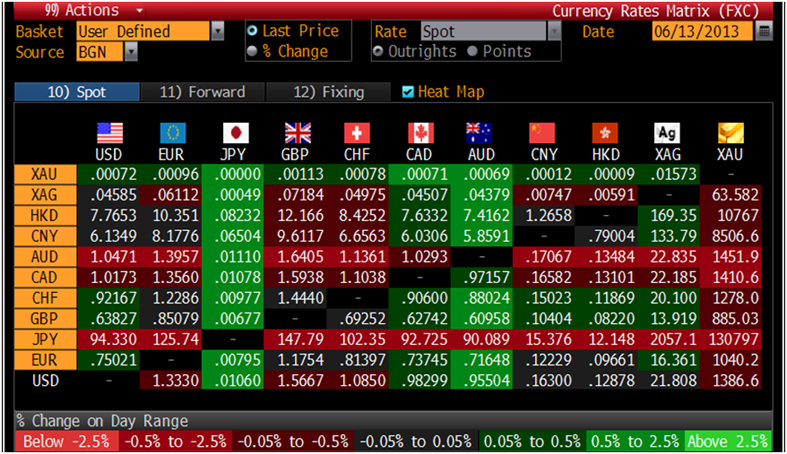
Cross Currency Table – (Bloomberg)

The U.S. Mint has sold 1,628,000 ounces of silver coins so far in June, according to figures on the Mint’s website. At that pace, total sales for the month would be 4,651,429 ounces, up 62.8% from a year earlier:
================================================================
Total
Ounces        YOY%        MOM%
================================================================
June 2013
Month-to-Date       1,628,000
Full month pace     4,651,429       62.8%       34.5%
—————————————————————-
May 2013             3,458,500       20.3%      -15.4%
April 2013           4,087,000      168.9%       21.8%
March 2013           3,356,500       32.0%       -0.4%
—————————————————————-
Feb. 2013            3,368,500      126.1%      -55.1%
Jan. 2013            7,498,000       22.8%      358.6%
================================================================
Total
Ounces        YOY%        MOM%
================================================================
Dec. 2012            1,635,000      -18.6%      -48.3%
Nov. 2012            3,159,500      128.3%        0.2%
Oct. 2012            3,153,000        2.9%       -2.2%
Sept. 2012           3,225,000      -27.7%       12.4%
Aug. 2012            2,870,000      -22.0%       26.0%
July 2012            2,278,000      -23.2%      -20.3%
June 2012            2,858,000      -16.0%       -0.6%
May 2012             2,875,000      -21.3%       89.1%
—————————————————————-
April 2012           1,520,000      -46.1%      -40.2%
March 2012           2,542,000       -8.1%       70.6%
Feb. 2012            1,490,000      -54.0%      -75.6%
Jan. 2012            6,107,000       -4.9%      204.0%
Dec. 2011            2,009,000       13.4%       45.2%
Nov. 2011            1,384,000      -67.5%      -54.8%
Oct. 2011            3,064,000       -2.7%      -31.3%
Sept. 2011           4,460,500      137.3%       21.2%
================================================================
Total
Ounces        YOY%        MOM%
================================================================
Aug. 2011            3,679,500       50.1%       24.0%
July 2011            2,968,000       -0.4%      -12.8%
June 2011            3,402,000       13.4%       -6.9%
May 2011             3,653,500        0.5%       29.6%
—————————————————————-
April 2011           2,819,000       12.4%        1.9%
March 2011           2,767,000      -18.2%      -14.6%
Feb. 2011            3,240,000       58.0%      -49.5%
Jan. 2011            6,422,000       78.8%      262.4%
Dec. 2010            1,772,000      -36.1%      -58.4%
Nov. 2010            4,260,000       64.7%       35.2%
Oct. 2010            3,150,000        7.2%       67.6%
Sept. 2010           1,880,000       10.4%      -23.3%
Aug. 2010            2,451,000       15.1%      -17.8%
July 2010            2,981,000        6.1%       -0.7%
June 2010            3,001,000       33.7%      -17.5%
May 2010             3,636,500       90.9%       45.0%
================================================================
Total
Ounces        YOY%        MOM%
================================================================
April 2010           2,507,500       -0.4%      -25.8%
March 2010           3,381,000        8.0%       64.9%
Feb. 2010            2,050,000       -3.5%      -42.9%
Jan. 2010            3,592,500       89.1%       29.5%
Dec. 2009            2,773,500       28.5%        7.2%
Nov. 2009            2,586,500       26.2%      -12.0%
Oct. 2009            2,939,000      106.2%       72.6%
Sept. 2009           1,703,000       -6.7%      -20.0%
Aug. 2009            2,130,000       17.5%      -24.2%
July 2009            2,810,000      124.5%       25.2%
June 2009            2,245,000       29.4%       17.9%
May 2009             1,904,500       25.6%      -24.4%
—————————————————————-
April 2009           2,518,000       59.0%      -19.6%
March 2009           3,132,000       68.8%       47.4%
Feb. 2009            2,125,000      962.5%       11.8%
Jan. 2009            1,900,000      -12.4%      -12.0%
================================================================
Total
Ounces        YOY%        MOM%
================================================================
Dec. 2008            2,158,500       -7.1%        5.3%
Nov. 2008            2,050,000       70.8%       43.9%
Oct. 2008            1,425,000      159.1%      -21.9%
Sept. 2008           1,825,000      138.6%        0.7%
Aug. 2008            1,813,000       55.6%       44.9%
July 2008            1,251,500      209.0%      -27.9%
June 2008            1,735,500      269.3%       14.5%
May 2008             1,516,000      283.8%       -4.3%
—————————————————————-
April 2008           1,584,000      465.7%      -14.6%
March 2008           1,855,000      143.4%      827.5%
Feb. 2008              200,000      -60.0%      -90.8%
Jan. 2008            2,170,000      102.8%       -6.6%
Dec. 2007            2,324,500       41.7%       93.6%
Nov. 2007            1,200,500      515.6%      118.3%
Oct. 2007              550,000       93.0%      -28.1%
Sept. 2007             765,000       39.1%      -34.3%
================================================================
Total
Ounces        YOY%        MOM%
================================================================
Aug. 2007            1,165,000      182.1%      187.7%
July 2007              405,000       -2.9%      -13.8%
June 2007              470,000      -38.2%       19.0%
May 2007               395,000      -66.7%       41.1%
—————————————————————-
April 2007             280,000      -79.9%      -63.3%
March 2007             762,000      -28.9%       52.4%
Feb. 2007              500,000      -49.6%      -53.3%
Jan. 2007            1,070,000       -4.0%      -34.8%
Dec. 2006            1,640,000      -23.5%      741.0%
Nov. 2006              195,000      -73.1%      -31.6%
Oct. 2006              285,000      -28.8%      -48.2%
Sept. 2006             550,000      -24.1%       33.2%
Aug. 2006              413,000      -32.8%       -1.0%
July 2006              417,000       17.5%      -45.1%
June 2006              760,000       90.0%      -35.9%
May 2006             1,186,000      276.5%      -15.0%
================================================================
Total
Ounces        YOY%        MOM%
================================================================
April 2006           1,395,000      190.6%       30.1%
March 2006           1,072,000       64.9%        8.0%
Feb. 2006              993,000       98.6%      -10.9%
Jan. 2006            1,115,000        1.8%      -48.0%
Dec. 2005            2,145,000      -18.2%      195.9%
Nov. 2005              725,000       47.2%       81.3%
Oct. 2005              400,000       25.0%      -44.8%
Sept. 2005             725,000       25.0%       17.9%
Aug. 2005              615,000       97.7%       73.2%
July 2005              355,000      108.8%      -11.3%
June 2005              400,000      -20.8%       27.0%
May 2005               315,000      -65.6%      -34.4%
—————————————————————-
April 2005             480,000      -29.4%      -26.2%
March 2005             650,000       86.8%       30.0%
Feb. 2005              500,000      -61.0%      -54.3%
Jan. 2005            1,095,000      -21.4%      -58.2%
================================================================
Total
Ounces        YOY%        MOM%
================================================================
Dec. 2004            2,622,500       32.1%      432.5%
Nov. 2004              492,500       33.1%       53.9%
Oct. 2004              320,000      -54.6%      -44.8%
Sept. 2004             580,000       22.1%       86.5%
Aug. 2004              311,000      -41.9%       82.9%
July 2004              170,000      -39.3%      -66.3%
June 2004              505,000        7.9%      -44.8%
May 2004               914,500      273.3%       34.5%
—————————————————————-
April 2004             680,000       56.7%       95.4%
March 2004             348,000      -60.3%      -72.8%
Feb. 2004            1,281,000       21.4%       -8.0%
Jan. 2004            1,392,500      -19.3%      -29.8%
Dec. 2003            1,985,000      -20.3%      436.5%
Nov. 2003              370,000      111.4%      -47.6%
Oct. 2003              705,500      355.2%       48.5%
Sept. 2003             475,000      -13.6%      -11.2%
================================================================
Total
Ounces        YOY%        MOM%
================================================================
Aug. 2003              535,000      -69.3%       91.1%
July 2003              280,000      -62.2%      -40.2%
June 2003              468,000      -32.7%       91.0%
May 2003               245,000      -50.5%      -43.5%
—————————————————————-
April 2003             434,000      -46.7%      -50.5%
March 2003             876,000        9.9%      -17.0%
Feb. 2003            1,055,000       16.6%      -38.8%
Jan. 2003            1,725,000       88.8%      -30.7%
Dec. 2002            2,490,000       73.3%     1322.9%
Nov. 2002              175,000      -83.0%       12.9%
Oct. 2002              155,000      -81.6%      -71.8%
Sept. 2002             550,000        0.0%      -68.5%
Aug. 2002            1,745,000      267.8%      135.8%
July 2002              740,000       18.5%        6.5%
June 2002              695,000       48.8%       40.4%
May 2002               495,000       16.2%      -39.3%
================================================================
Total
Ounces        YOY%        MOM%
================================================================
April 2002             815,000       45.0%        2.3%
March 2002             797,000        1.4%      -11.9%
Feb. 2002              905,000        6.9%       -0.9%
Jan. 2002              913,500       17.2%      -36.4%
Dec. 2001            1,436,500      -27.3%       39.3%
Nov. 2001            1,031,500       77.7%       22.3%
Oct. 2001              843,500      118.2%       53.4%
Sept. 2001             550,000       85.5%       15.9%
Aug. 2001              474,500       85.7%      -24.0%
July 2001              624,500       25.0%       33.7%
June 2001              467,000      -36.8%        9.6%
May 2001               426,000      -53.9%      -24.2%
—————————————————————-
April 2001             562,000      -30.1%      -28.5%
March 2001             786,000       -7.7%       -7.1%
Feb. 2001              846,500        4.7%        8.6%
Jan. 2001              779,500      -22.9%      -60.5%
================================================================
Total
Ounces        YOY%        MOM%
================================================================
Dec. 2000            1,975,000       15.0%      240.2%
Nov. 2000              580,500       58.6%       50.2%
Oct. 2000              386,500       10.7%       30.4%
Sept. 2000             296,500      -57.3%       16.0%
Aug. 2000              255,500      -66.7%      -48.8%
July 2000              499,500      -26.4%      -32.4%
June 2000              738,500      -14.4%      -20.2%
May 2000               925,000       16.8%       15.0%
—————————————————————-
April 2000             804,500       12.0%       -5.5%
March 2000             851,500       18.6%        5.3%
Feb. 2000              808,500      442.6%      -20.1%
Jan. 2000            1,011,500      -15.4%      -41.1%
Dec. 1999            1,718,000      587.2%      369.4%
Nov. 1999              366,000      -42.4%        4.9%
Oct. 1999              349,000      -62.1%      -49.7%
Sept. 1999             694,000       54.2%       -9.6%
================================================================
Total
Ounces        YOY%        MOM%
================================================================
Aug. 1999              768,000       31.3%       13.2%
July 1999              678,500      384.6%      -21.4%
June 1999              863,000      475.3%        9.0%
May 1999               792,000       93.2%       10.3%
—————————————————————-
April 1999             718,000      857.3%        0.0%
March 1999             718,000      395.2%      381.9%
Feb. 1999              149,000       49.0%      -87.5%
Jan. 1999            1,195,000      159.8%      378.0%
Dec. 1998              250,000      -71.6%      -60.6%
Nov. 1998              635,000      182.2%      -31.0%
Oct. 1998              920,000      283.3%      104.4%
Sept. 1998             450,000      150.0%      -23.1%
Aug. 1998              585,000      800.0%      317.9%
July 1998              140,000      -54.1%       -6.7%
June 1998              150,000      -31.8%      -63.4%
May 1998               410,000       54.7%      446.7%
================================================================
Total
Ounces        YOY%        MOM%
================================================================
April 1998              75,000      -73.8%      -48.3%
March 1998             145,000       -3.3%       45.0%
Feb. 1998              100,000      -74.0%      -78.3%
Jan. 1998              460,000        5.7%      -47.7%
Dec. 1997              880,000      -34.5%      291.1%
Nov. 1997              225,000      -53.6%       -6.3%
Oct. 1997              240,000       -4.0%       33.3%
Sept. 1997             180,000       71.4%      176.9%
Aug. 1997               65,000      -71.7%      -78.7%
July 1997              305,000      306.7%       38.6%
June 1997              220,000      -15.4%      -17.0%
May 1997               265,000      960.0%       -7.3%
—————————————————————-
April 1997             286,000       63.4%       90.7%
March 1997             150,000      -63.7%      -61.0%
Feb. 1997              385,000      413.3%      -11.5%
Jan. 1997              435,000     1350.0%      -67.6%
================================================================
Total
Ounces        YOY%        MOM%
================================================================
Dec. 1996            1,343,000      -28.4%      176.9%
Nov. 1996              485,000       56.5%       94.0%
Oct. 1996              250,000      400.0%      138.1%
Sept. 1996             105,000      -30.0%      -54.3%
Aug. 1996              230,000      206.7%      206.7%
July 1996               75,000      -40.0%      -71.2%
June 1996              260,000       92.6%      940.0%
May 1996                25,000      -86.5%      -85.7%
—————————————————————-
April 1996             175,000      -30.0%      -57.6%
March 1996             413,000      -21.3%      450.7%
Feb. 1996               75,000      -73.7%      150.0%
Jan. 1996               30,000      -95.2%      -98.4%
Dec. 1995            1,875,000      -25.3%      504.8%
Nov. 1995              310,000      148.0%      520.0%
Oct. 1995               50,000      -77.8%      -66.7%
Sept. 1995             150,000         n/a      100.0%
================================================================
Total
Ounces        YOY%        MOM%
================================================================
Aug. 1995               75,000      -80.0%      -40.0%
July 1995              125,000      -45.7%       -7.4%
June 1995              135,000       35.0%      -27.0%
May 1995               185,000      -64.8%      -26.0%
—————————————————————-
April 1995             250,000       42.9%      -52.4%
March 1995             525,000       16.7%       84.2%
Feb. 1995              285,000      -17.4%      -54.4%
Jan. 1995              625,000       30.2%      -75.1%
Dec. 1994            2,510,500      188.6%     1908.4%
Nov. 1994              125,000        0.0%      -44.4%
Oct. 1994              225,000      350.0%         n/a
Sept. 1994                   0     -100.0%     -100.0%
Aug. 1994              375,000      -31.8%       63.0%
July 1994              230,000       -8.0%      130.0%
June 1994              100,000      -78.0%      -81.0%
May 1994               525,000        5.0%      200.0%
================================================================
Total
Ounces        YOY%        MOM%
================================================================
April 1994             175,000      -58.8%      -61.1%
March 1994             450,000      -11.8%       30.4%
Feb. 1994              345,000      -59.4%      -28.1%
Jan. 1994              480,000      -41.8%      -44.8%
Dec. 1993              870,000      -21.5%      596.0%
Nov. 1993              125,000      -80.0%      150.0%
Oct. 1993               50,000      -74.4%      -89.6%
Sept. 1993             480,000       20.0%      -12.7%
Aug. 1993              550,000       14.6%      120.0%
July 1993              250,000      -19.4%      -45.1%
June 1993              455,000       51.7%       -9.0%
May 1993               500,000       92.3%       17.6%
—————————————————————-
April 1993             425,000       37.1%      -16.7%
================================================================
SOURCE: U.S. Mint
Societe Generale see silver outperforming gold in the second half of 2013.
Silver’s poor performance is despite still strong fundamentals. Even a small increase in store of wealth demand due to ongoing currency debasement will propel prices much higher.
Contrarian buyers continue to accumulate on this latest dip and silver will continue to protect from financial and economic dislocations.

Economist & Analyst : If The Fed Lose Control, The Downside Move In Markets May Be Terrifying. Almost Every Major Asset Class in the World Is ‘Brutally Overpriced’ On Fed Policy

Federal Reserve policy has been credited often with pushing up stock prices, but one research firm believes the central bank has pushed all asset prices to extreme levels.
“We think investors with a longer-term outlook should tread carefully in financial markets,” TrimTabs said in its widely followed weekly market analysis. “TheFederal Reserve and its fellow central banks have succeeded in making almost every major asset class in the world overpriced.”
While the S&P 500 has climbed more than 15 percent year-to-date, other risk assets have surged as well, while the Fed has expanded its balance sheet past $3.4 trillion in efforts to spur growth.
TrimTabs cites a few: Global junk bond issuance (a record $254 billion through May); house flipping in California, which a recent Wall Street Journal reportpegged at its fastest pace since 2005; and the increased creation of collateralized debt obligations, the instruments that helped create the financial crisis. They are around pre-crisis levels.
http://www.cnbc.com/id/100803010
Charles Gave Warns: “Should The Fed Lose Control, The Downside Move In Markets May Be Terrifying
Charles Gave of GaveKal has a fascinating summary of where the nearly five-year long experiment in central-planning has taken the US, and by implication, global economy. To wit:
 
 
What kind of failure?

By propping up asset markets, the Fed has created an illusion that wealth is being created. The next step, according to Bernanke’s plan,  should be for growth to follow. In fact, there is no reason why the rise in prices of financial assets should lead to actual investments or a rise in the median income. So far, it has not. There has been no real increase in the private sector propensity to borrow, and the danger may be that any further public sector borrowing will hasten the decline because of our “permanent asset hypothesis”.

This means that, should the Fed lose control of asset prices (is this what is now happening in Japan?), then the game will be up and the downside move in markets may well be terrifying. Most at risk would be low and medium quality credits, banks, commodity producers, and any companies with negative cash-flow.

It is obvious, then, that if Bernanke’s experiment fails, it will be a profoundly deflationary failure. The best hedges in a deflation and in financial panic are US long bonds and the US dollar. Renminbi bonds seem also to be developing safe-harbor status. In fact, we found it interesting how, in May, every bond market around the world sold-off, except for the RMB bond market.

http://www.zerohedge.com/news/2013-06-10/charles-gave-warns-should-fed-lose-control-downside-move-markets-may-be-terrifying

No Picnic for U.S & Emerging market Bonds if this happens!

CLICK ON CHART TO ENLARGE
Aggregate Bond ETF (AGG) and Emerging Markets Bond ETF (EMB) have declined rather sharply of late.  The declines has taken each of them down to multi-year support lines at (1) in the charts above. This 2-pack reflects that interest rates all over the world are rising and causing bond prices to decline!
It would be “NO PICNIC” for long bond holders if these support lines would break, because the next key support is well below current levels!
http://blog.kimblechartingsolutions.com/2013/06/no-picnic-for-u-s-emerging-market-bonds-if-this-happens/
It’s time to panic about Treasurys
http://blogs.marketwatch.com/cody/2013/06/10/its-time-to-panic-about-treasurys/
Grantham Says Assets ‘Brutally Overpriced’ on Fed Policy
Jeremy Grantham, chief investment strategist at Grantham Mayo Van Otterloo & Co., said global asset prices have climbed too high because of the U.S. Federal Reserve’s expansive monetary policy.
“All global asset assets are once again becoming overpriced,” Grantham wrote in a quarterly letter released today. U.S. companies, other than “quality” stocks with stable earnings and low debt, and most global growth equities, are “brutally overpriced,” Grantham wrote.
http://www.bloomberg.com/news/2013-02-06/grantham-says-assets-brutally-overpriced-on-fed-policy.html

The Smoke And Mirrors Are Running Out
Those who believe the economy is recovering are ignorant of the facts. Other than the Great Depression no US recovery (and I don’t believe we are in a recovery) taken longer. Eventually it may take more than a decade like the 1930s. Or perhaps it will be like Japan which is in its third decade of “recovery.”
Politics and Economics
The truth is that our economy is spent, exhausted and filled with misallocations and distortions made much worse by government interventions. There is no recovery, nor will there be one until a massive purge (usually referred to as a depression) occurs. This event will result in bankruptcies that release scarce, misallocated physical capital from unproductive and unwanted areas to places where it is needed and can be utilized efficiently.
http://www.zerohedge.com/news/2013-06-10/guest-post-smoke-and-mirrors-running-out

Guan Eng: More Malaysians should be like Nazir

By Opalyn Mok
GEORGE TOWN, June 12 ― Penang Chief Minister Lim Guan Eng today commended Datuk Seri Nazir Razak for his outspokenness, even as the CIMB Group boss continues to come under attack for defending AirAsia X CEO Azran Osman Rani for the same trait.
Lim urged Malaysians to emulate Nazir in speaking their minds despite the risk of backlash.
“I hope his brother (Prime Minister Datuk Seri Najib Razak) can be just as brave as him,” he said while condemning a news article in Utusan Malaysia that had labelled Nazir as “anti-Malay” for his praise of Azran.
Azran had criticised Utusan Malaysia for an inflammatory headline, “Apa lagi Cina mau?”, which it ran immediately after the Election 2013. This led to the newspaper to take aim at him and proclaim a boycott against advertising from the airline that he helms.
On Monday, Nazir defended Azran for his forthright attitude, saying that this is the “mark of a leader”, leading to attacks against the banker.
Lim also accused Utusan Malaysia today of turning Malaysians on one another through what he called racially-toned articles.
Related story: Najib’s brother accused of undermining Umno by backing AirAsia X CEO
Related story: Nazir commends Azran for his frank views
Related story: 'Spat with Utusan has no bearing on AirAsia X'

“Malaysians do not want to be enemies with each other so I hope more Malaysians will be like Nazir,” the DAP secretary-general said in a press conference at his office this afternoon.
Malay-Muslim groups have criticised both Nazir and Azran for their views, branding both of them as “anti-Malay” and for forgetting “their roots”.
Yesterday, the Muslim Consumer Association of Malaysia had in a statement reminded Nazir and Azran of their roots and told them not to be arrogant because of their wealth, position and property.
In a blog post reproduced by Umno-owned Utusan Malaysia today, former information minister Tan Sri Zainuddin Maidin accused Nazri of plunging brother Najib and Umno deeper into a post-polls “crisis of confidence” by coming to Azran’s defence.
He said Nazir, the CEO of CIMB Group and the younger brother to Prime Minister Najib, had likely thought that Barisan Nasional (BN) would recapture some of lost support from the Chinese had Utusan Malaysia not targeted the community.
“But in truth, Nazir only added to the problems faced by Datuk Seri Najib and Umno,” the former minister said in a blog posting that was published in Utusan Malaysia today.
Zainuddin further asked if labelling Azran forthright and frank meant Nazir was joining the ranks of those who have accused Utusan Malaysia of being racist.
Zainuddin went on to justify Utusan’s “brave” backing of Umno in fighting off the rival elements that have eroded public confidence in the government, which he said had opened the newspaper to financial risks.

The US farm bill is a corporate victory and a slap to struggling Americans

The US Congress wants to deny 2 million people food stamps, while hardly denting large agribusinesses
Farming
The latest US farm bill would substantially cut food stamps. Photograph: Andrew Matthews/PA
The cost of providing poor Americans with food stamps has doubled in the past four years, reflecting the fact that a record 47.8 million people are struggling to feed themselves and their families. The US Congress has an answer to the growth in poverty: force more people to struggle.
This glib response to a national crisis will be tested in the farm bill that passed the US Senate on Monday and will be up for debate in the House soon. Even though it's called "the farm bill," it's actually the legislation that primarily funds the Supplemental Nutrition Assistance Program – better known as food stamps.
The Senate version would cut food stamps by $400m a year, adding up to $4bn over the decade covered by the bill. The House version, up for bitter debate starting next week, promises to cut even more: $20bn, mostly as a sop to conservative lawmakers who killed the bill last year because of what they considered a measly $16bn in cuts. At the current size, the House bill would deny 2 million people with low incomes access to food stamps, Reuters said.
By cutting the food stamp program, lawmakers are trying to make room or trade political points for what they really have to do, which is cut wasteful and ineffective subsidies to wealthy farmers that favor factory farming and disadvantage small farmers who make less than $250,000 a year. By the way, some of those wealthy farmers benefitting from subsidies in the farm bill are, very conveniently, also members of Congress.
And before you start believing this is an issue just concerning "the poor," remember that poverty has increasingly affected the middle class, too. Food stamps were initially created to help feed working families. Even now, a man or woman working full-time at minimum wage is making only $15,000 a year – a salary so low that it is eligible for food stamps. Not only do 14% of Americans live in poverty, but in some suburbs, food stamp use has doubled or even tripled. CNN Money told the story of one New Jersey suburb, Morris County, where food stamp use had grown by 240% by 2012. Then, of course, there is the unemployment crisis as 12 million Americans remain unemployed, about 40% of them for long-term periods longer than 6 months.
It should be clear to members of Congress that improving the financial lot of Americans is more important than any other task at hand, as well as a task they have consistently failed to accomplish. Yet legislators keep blowing their chances to do anything constructive, leading even Federal Reserve chairman Ben Bernanke to chide fussbudget lawmakers for their counterproductive waste of time on cutting pie-in-the-sky estimates of deficits.
So, in response to this very real, very pressing, very immediate crisis, Congress is creating a particularly grotesque imitation of economic stimulus. Congress is not providing any alternatives to struggling families as it cuts the food stamp program, it is just slashing the cost and hoping that poverty – and its siblings, unemployment and crime and homelessness – fix themselves. Good plan.
This bill, like almost everything else in Congress, will prove a testing ground for what America values more: partisan power and petty bickering, or some progress, however meager, on our ongoing economic crisis. The economic recovery is not real. The farm bill is an economic disaster as well as a public health disaster.
There is one thing that can change this: any kind of response from Americans. Unfortunately, too many have been silent on the subject of the farm bill. That will leave Congress, over the next few weeks of debate, to listen selectively to the the voices that are loudest: their donors in big agricultural companies and among wealthy farmers. In one year – 2009 to 2010 – those groups poured $8.5m into the fundraising coffers of members of the House Agriculture Committee.
Needless to say, corporate sponsors don't much care what happens to food stamps. Let's see if they carry the day.

Thomson Reuters Gives Elite Traders Early Advantage


Getty Images
The Thomson Reuters building in New York.
A closely watched consumer confidence number that routinely moves markets upon release is accessed by an elite group of traders, for a fee, a full two seconds before its official release, according to a document obtained by CNBC.
A contract signed by Thomson Reuters, the news agency and data provider, and the University of Michigan, which produces the widely cited economic statistic, stipulates that the data will be posted on the web for the general public at 10 a.m. on the days it is released.
Five minutes before that, at 9:55 a.m., the data is distributed on a conference call for Thomson Reuters' paying clients, who are given certain headline numbers.
But the contract carves out an even more elite group of clients, who subscribe to the "ultra-low latency distribution platform," or high-speed data feed, offered by Thomson Reuters. Those most elite clients receive the information in a specialized format tailor-made for computer-driven algorithmic trading at 9:54:58.000, according to the terms of the contract. On occasion, they could get the data even earlier—the contract allows for a plus or minus 500 milliseconds margin of error.
In the ultra-fast world of high-speed computerized markets, 500 milliseconds is more than enough time to execute trades in stocks and futures that would be affected by the soon-to-be-public news. Two seconds, the amount promised to "low latency" customers, is an eternity.
For exclusive access to the data, Thomson Reuters pays the University of Michigan $1 million per year, according to the contract, in addition to a "contingent fee" based on the revenue generated by Thomson Reuters. The contract reviewed by CNBC was signed in September 2009. It expired a year later. Thomson Reuters and the University Michigan confirmed that the relationship still exists.
In a statement, Thomson Reuters said, "Through an agreement with University of Michigan, Thomson Reuters is the exclusive distributor of the Thomson Reuters/University of Michigan Surveys of Consumers to its clients through various subscription services as well as to the general public via a press release. Details of the tiered release of this data are provided openly to Thomson Reuters customers and the wider public and anyone wishing to trade on this data can pay for the service that best meets their data needs."
(Read more: Early Data Underscores Moral, Technology Dilemma)
Many market participants are not aware that some traders get a head start on market-moving data with plenty of time to execute trades before the general public receives the same information. And the existence of an elite group that receives early information is likely to attract criticism that it doesn't square with the principle that market-moving information should be released to all market participants equally.
"I worry that there's both a fairness and a disclosure issue," said former Securities and Exchange Commission Chairman Harvey Pitt. "If I'm paying a lot of money, I should know whether I have the best deal possible. If there was no disclosure of the tiered structure, that would be a serious problem."
To demonstrate that it disclosed the existence of a two-second lead time, Thomson Reuters sent CNBC a link to a Webpage of marketing material detailing the system. There, the firm cited a major market move on Aug. 12, 2011, in which U.S. stocks slipped after consumer sentiment data was released. "Thomson Reuters News Feed Direct customers benefited from the 2-second advance and the fastest delivery in the market," the site said. The firm explained that this disclosure can be found on the "Machine Readable News" product page of its Website, under a drop-down menu for "suite components."

Thomson Reuters declined to reveal how much it charges for access to each tier of data it sells. Thomson Reuters distributes a wide range of data on economic indicators to its customers.
(Read More: When Milliseconds Can Mean Riches or Roadkill)
The consumer confidence number is a measure of household opinion about the state of the economy that has been conducted since the 1940s. Surveyors conduct telephone interviews to gauge consumer sentiment. It is looked to by market professionals as a guide to where the economy might be heading, or how well consumers are dealing with adverse economic events.
Within milliseconds, the new data causes market reaction—a move that can come the instant Thomson Reuters transmits the data to its elite group of traders. On May 17, for example, trading volume exploded in the Spider ETF at exactly 9:54:57.975. More than 100,000 shares traded hands in the first 10 milliseconds of the burst of activity, reports the analysis firm Nanex, LLC. Within 100 milliseconds, the price of SPY jumped from $165.90 to more than $166.06.
In the first half second of the trading burst, Nanex calculates that more than $40 million changed hands, just in the Spider ETF.
By 10 seconds into the event, more than $100 million had changed hands.
It takes a human being between 300 and 400 milliseconds to blink an eye.
Several economists contacted by CNBC said they were unaware that the data are released to the elite group two seconds before the 9:55 conference call. One called the release "disingenuous," another called it "unfair."

Thomson Reuters did not respond to a request for comment on those economists' remarks.
But Pitt pointed out that private entities are usually free to distribute their own work product however they see fit, as long as they disclose what their arrangements are. "A nongovernmental and noncorporate individual's generic data analysis can be market moving, but if so that is merely a reflection solely of the work product of that individual," Pitt said. "The insider trading laws can't—and shouldn't—be read to deprive the progenitor of personal analyses of the potential market uses that person can make of the data."
In marketing material on its Website, Thomson Reuters touts the virtue to traders of its economic data. "Be The First To React," says the site, explaining that the service offers "Data Your Algorithms Can Interpret."
The University of Michigan's arrangement with Thomson Reuters dates to 2007, said a university spokesman. "This is something that's been reviewed carefully," said university spokesman Rick Fitzgerald. "It's been in place for a number of years, and we think it complies with all the regulations." Fitzgerald said the total amount received by the university under the deal has been "very close" to a million dollars each year.
Asked why a taxpayer-financed university should sell data to Wall Street before it releases it to the taxpayers, Fitzgerald said: "Most of our research funding comes from private sources."
Richard Curtin, director of the Thomson Reuters/University of Michigan Surveys of Consumers at the Survey Research Center of the University of Michigan, defended the arrangement. "This research project is privately financed," he said. "Without the support from Thomson Reuters, no data would be collected, the project would no longer exist and the public benefit would disappear."

As for the university's role, former SEC chairman Pitt said, "I think public colleges should set a higher standard, but they need to get their money wherever they can, I suppose."
Within the past week, there have been two incidents involving trading ahead of the official release of market-moving data.
On June 3, Thomson Reuters inadvertently sent market-moving ISM manufacturing data early to its paying clients, many of whom immediately traded on the information before it was available to the wider market.
The manufacturing data, which that day came in disappointingly low and sent traders scrambling to sell shares, was set to be released at precisely 10 a.m. by the Institute for Supply Management, a private entity that puts out the data each month. Nanex showed a spike in the trading volume of the ETF SPY 15 milliseconds before 10 a.m., and a corresponding move down in the price ahead of the official release time of the information as computer trading algorithms processed the data and executed trades. Thomson Reuters said the accidental release was due to a "minor clock synchronization issue." The firm said it would take steps to fix the problem.
Separately, on Friday, Nanex spotted a burst of trading about a half second before release of the Department of Labor's highly scrutinized monthly jobs data, which often set the tone for market trading all day. It remains unclear what caused that spike in trading. There is no evidence that Thomson Reuters or the University of Michigan were involved with this early release of data.
Asked about the event, a Department of Labor spokesman said officials there saw nothing unusual during the "lock-up" in which members of the media are given the number in advance and asked to hold it for a precise 8:30 a.m. release time.
"I am not aware of any information slippage," said Labor Department spokesman Carl Fillichio. "There was nothing evidentially unusual during [the] lock up."
However, Fillichio did not discount the possibility of a mistake. "You should remember that even if there was human error on our part and even if the switch was hit milliseconds early, everyone in the lockup would have been affected, so it would have still been a level playing field," Fillichio said.
_By CNBC's Eamon Javers. Follow him on Twitter at
. CNBC's Steve Liesman contributed to this report.

Does America Still Know Rule Of Law – Nationally, Internationally, Or At All

This article is an excerpt from the Mountain Vision newsletter, an excellent service which we strongly recommend.
In last week’s Mountain Vision Update, Frank alerted our Mountaineers to the alarming rise of yields in bonds around the world. That signal should not be underestimated or disregarded lightly, as it may have a huge impact on all financial markets.
Bonds are being sold by banks around the world. In Japan, banks sold a huge chunk of their bond holdings – most probably in expectation of the much-proclaimed global recovery. As Mountaineers know, we have strong doubts about this “recovery story”. Fundamental realities just don’t match up.
However, the mainstream appears to believe in it. And therefore, they are concerned about an improving economy, accompanied by rising interest rates. Afraid of the potential blood-bath in bonds, they have started selling…and selling hard. That, in fact, may become a self-fulfilling prophecy that has the potential of flowing over into other financial markets, and certainly the stock market.
In this context, I came across an interesting article posted by Humble Student of the Markets, which expands on the above. The article is titled “The bear case for equities”. The articles is timely and worth the read.

The US-Swiss “Tax Deal” – Does the US Still Understand Rule of Law ?!

The US-Swiss tax deal is, as you can probably imagine (and what we would have hoped), turning into a hotly debated topic in Switzerland. At this point, it does not appear as though the Swiss Parliament will accept the deal, which was plunked down on their desks with much secrecy, little time to decide, and no flexibility on the terms. This, combined with the latest revelations about alleged CIA activities in Switzerland, will most probably kill the deal.
Frank, in an exclusive interview with the International Man, discussed this topic with Nick Giambruno of IM in depth. We’ve added that interview in the commentary below. However, as an American living in Switzerland, I’d like to add my two cents in a somewhat “less Swiss and diplomatic” manner here.
What concerns me most as an American is that the US does not really care whether Swiss banks have done anything wrong or not. Yes, some bankers at UBS and a few other banks have probably breached US law by entering the US and giving Americans advice and/or support in hiding their funds overseas in an attempt to evade taxes. However, the current broad allegations and incredible pressure against Swiss banks in general is unfounded.
Where has international rule of law gone?!?! Just because a Swiss bank – one without any presence or advisory action in the US – receives funds from a US person, declared or not, doesn’t mean the bank breached any US tax or SEC rules. And the bank should certainly not be held liable under US law unless it, in fact, acted within the US jurisdiction.
The principles of international law would be on very shaky ground if suddenly we would be required to maintain foreign law in our jurisdiction. For example, abortion is illegal in Poland. What if a Polish woman decides to travel to America, or to Switzerland, for the purpose of having an abortion? Should America or Switzerland now be required to prosecute the woman since she breached Polish law?
What if I go to Germany to “really” drive my car on the German Autobahn? Germany is well-known for its no-speed-limit freeways. And, from my experience of even just last weekend, I can tell you that it is quite a rush. However, in Switzerland, we have a maximum speed limit of 120 km/h. If I’m driving 140km/h in Germany, should the Swiss be able to fine me for driving too fast in Germany. Or, furthermore, should the Germans be required to arrest and extradite me right there on the spot based on Swiss law? Of course not!
Let’s come back to an example at the heart of the issue: a Swiss banker meets a prospective US investor in Zurich, Switzerland. The Swiss bank accepts that US person as a client and the client deposits his dollars with the bank. Then, the same US client later decides not to report his Swiss bank account. Has the Swiss banker done anything illegal? Well not according to Swiss law. Nor has the Swiss banker broken any US law. The US taxpayer, on the other hand, may be liable for tax evasion because he did not file his FBAR and didn’t report earnings.
So why is Switzerland even considering this so-called “deal”? The reason is very simple: America is simply not playing by the rules. Just as was the case in the situation with the Swiss private bank, Wegelin, they are threatening to block US dollar transactions. No bank can afford to not be able to transact in US dollars or to invest in the US markets. The US Dept. of Justice is using this as leverage and a threat to destroy several leading Swiss banks – whether the allegations against the banks are legally justified or not.
What is this all about anyway? Is America in such bad shape that it needs to criminalize its citizens and its supposed Swiss friends? Is complete citizen transparency and so-called “tax justice” really important enough to throw our long-time values and principles of freedom overboard? What’s happened to the country I grew up in?
I apologize if I’m stepping on the toes of any of my fellow Americans, but this is exactly how I’m seeing it perched up here in the Alps from my Mountain Vision.
This article is an excerpt from the Mountain Vision newsletter, an excellent service which we strongly recommend.