Today’s AM fix was USD 1,386.25, EUR 1,039.71 and GBP 885.33 per ounce.
Yesterday’s AM fix was USD 1,377.25, EUR 1,036.77 and GBP 878.40 per ounce.
Gold climbed $10.00 or 0.73% yesterday to $1,388.70/oz and silver surged to $22.012 and finished up 0.37%.

Silver in USD, 5 Year – (Bloomberg)
Silver continues to perform very poorly and is down 28% year to date to make it one of the worst performing commodities in the world and on track for its worst performance since 1984.
At the end of 2012, investors expected silver to be one of the biggest gainers in 2013, expecting a 33% return, a Bloomberg survey showed. Analysts expected silver to surge because either turmoil would boost demand for precious metals as a protection against inflation and currency debasement or accelerating growth would spur more industrial buying for everything from solar panels to batteries.

Total Known Silver ETF Holdings – (Bloomberg)
Investors are maintaining their belief in silver even as they lose faith in gold. While the amount of silver held through exchange-traded products is little changed this year, and within 5% of the record reached in March, gold holdings dropped 19%, data compiled by Bloomberg show.
Holdings of silver in ETPs rose 1.1 tons this year, compared with a 1,621-ton expansion in 2012, data compiled by Bloomberg show.
Silver investments stand at 18,905.8 metric tons, valued at $13.2 billion and enough to meet global demand for jewelry and silverware for almost three years. The value of gold ETP investments slumped 34% to $94.1 billion this year.
Investors for now are treating silver more like a precious metal than an industrial one, with its 30-week correlation coefficient to gold at 0.85, from 0.68 in 2011. A figure of 1 means the two move in lockstep.
Silver also tumbled into a bear market in April and is 56% below the record $49.8044 reached in April 2011. However, silver is up 63% in the last 5 years of the financial crisis, thereby protecting investors and savers globally from stock market crashes, bail-ins and currency debasement.

Precious Metals & Currency Ranked Returns in South African Rand
Hedge funds and other large speculators have turned bullish again after betting on lower prices as recently as mid-May, U.S. Commodity Futures Trading Commission data show. They are holding a net-long position of 1,230 futures and options, compared with a five-year average of 21,400 contracts.
Industrial demand may gain as the global economy improves, with the International Monetary Fund predicting growth of 3.3 percent this year and 4 percent in 2014, from 3.2 percent in 2012. About 50 percent of silver is used in industry, compared with 10 percent for gold, data from the Silver Institute and London-based World Gold Council show.
Consumption by industrial users will rise 1.7 percent to a three-year high of 14,625 tons this year and gain another 2.8 percent in 2014, Barclays Plc predicts. A car contains as much as 30 grams (1.1 ounces) and a mobile phone as much as 0.25 gram, according to Washington-based Silver Institute data.
The slump spurred demand for physical metal, with the U.S. Mint predicting last week that its gold and silver coin sales may reach a record in 2013.
The Austrian Mint sold about 2 million ounces of silver in April, compared with 8.8 million for all of 2012.
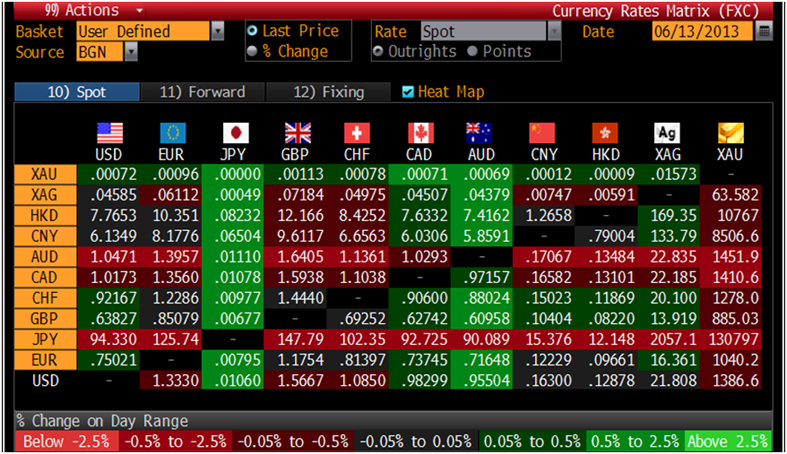
Cross Currency Table – (Bloomberg)
The U.S. Mint has sold 1,628,000 ounces of silver coins so far in June, according to figures on the Mint’s website. At that pace, total sales for the month would be 4,651,429 ounces, up 62.8% from a year earlier:
================================================================
Total
Ounces YOY% MOM%
================================================================
June 2013
Month-to-Date 1,628,000
Full month pace 4,651,429 62.8% 34.5%
—————————————————————-
May 2013 3,458,500 20.3% -15.4%
April 2013 4,087,000 168.9% 21.8%
March 2013 3,356,500 32.0% -0.4%
—————————————————————-
Feb. 2013 3,368,500 126.1% -55.1%
Jan. 2013 7,498,000 22.8% 358.6%
================================================================
Total
Ounces YOY% MOM%
================================================================
Dec. 2012 1,635,000 -18.6% -48.3%
Nov. 2012 3,159,500 128.3% 0.2%
Oct. 2012 3,153,000 2.9% -2.2%
Sept. 2012 3,225,000 -27.7% 12.4%
Aug. 2012 2,870,000 -22.0% 26.0%
July 2012 2,278,000 -23.2% -20.3%
June 2012 2,858,000 -16.0% -0.6%
May 2012 2,875,000 -21.3% 89.1%
—————————————————————-
April 2012 1,520,000 -46.1% -40.2%
March 2012 2,542,000 -8.1% 70.6%
Feb. 2012 1,490,000 -54.0% -75.6%
Jan. 2012 6,107,000 -4.9% 204.0%
Dec. 2011 2,009,000 13.4% 45.2%
Nov. 2011 1,384,000 -67.5% -54.8%
Oct. 2011 3,064,000 -2.7% -31.3%
Sept. 2011 4,460,500 137.3% 21.2%
================================================================
Total
Ounces YOY% MOM%
================================================================
Aug. 2011 3,679,500 50.1% 24.0%
July 2011 2,968,000 -0.4% -12.8%
June 2011 3,402,000 13.4% -6.9%
May 2011 3,653,500 0.5% 29.6%
—————————————————————-
April 2011 2,819,000 12.4% 1.9%
March 2011 2,767,000 -18.2% -14.6%
Feb. 2011 3,240,000 58.0% -49.5%
Jan. 2011 6,422,000 78.8% 262.4%
Dec. 2010 1,772,000 -36.1% -58.4%
Nov. 2010 4,260,000 64.7% 35.2%
Oct. 2010 3,150,000 7.2% 67.6%
Sept. 2010 1,880,000 10.4% -23.3%
Aug. 2010 2,451,000 15.1% -17.8%
July 2010 2,981,000 6.1% -0.7%
June 2010 3,001,000 33.7% -17.5%
May 2010 3,636,500 90.9% 45.0%
================================================================
Total
Ounces YOY% MOM%
================================================================
April 2010 2,507,500 -0.4% -25.8%
March 2010 3,381,000 8.0% 64.9%
Feb. 2010 2,050,000 -3.5% -42.9%
Jan. 2010 3,592,500 89.1% 29.5%
Dec. 2009 2,773,500 28.5% 7.2%
Nov. 2009 2,586,500 26.2% -12.0%
Oct. 2009 2,939,000 106.2% 72.6%
Sept. 2009 1,703,000 -6.7% -20.0%
Aug. 2009 2,130,000 17.5% -24.2%
July 2009 2,810,000 124.5% 25.2%
June 2009 2,245,000 29.4% 17.9%
May 2009 1,904,500 25.6% -24.4%
—————————————————————-
April 2009 2,518,000 59.0% -19.6%
March 2009 3,132,000 68.8% 47.4%
Feb. 2009 2,125,000 962.5% 11.8%
Jan. 2009 1,900,000 -12.4% -12.0%
================================================================
Total
Ounces YOY% MOM%
================================================================
Dec. 2008 2,158,500 -7.1% 5.3%
Nov. 2008 2,050,000 70.8% 43.9%
Oct. 2008 1,425,000 159.1% -21.9%
Sept. 2008 1,825,000 138.6% 0.7%
Aug. 2008 1,813,000 55.6% 44.9%
July 2008 1,251,500 209.0% -27.9%
June 2008 1,735,500 269.3% 14.5%
May 2008 1,516,000 283.8% -4.3%
—————————————————————-
April 2008 1,584,000 465.7% -14.6%
March 2008 1,855,000 143.4% 827.5%
Feb. 2008 200,000 -60.0% -90.8%
Jan. 2008 2,170,000 102.8% -6.6%
Dec. 2007 2,324,500 41.7% 93.6%
Nov. 2007 1,200,500 515.6% 118.3%
Oct. 2007 550,000 93.0% -28.1%
Sept. 2007 765,000 39.1% -34.3%
================================================================
Total
Ounces YOY% MOM%
================================================================
Aug. 2007 1,165,000 182.1% 187.7%
July 2007 405,000 -2.9% -13.8%
June 2007 470,000 -38.2% 19.0%
May 2007 395,000 -66.7% 41.1%
—————————————————————-
April 2007 280,000 -79.9% -63.3%
March 2007 762,000 -28.9% 52.4%
Feb. 2007 500,000 -49.6% -53.3%
Jan. 2007 1,070,000 -4.0% -34.8%
Dec. 2006 1,640,000 -23.5% 741.0%
Nov. 2006 195,000 -73.1% -31.6%
Oct. 2006 285,000 -28.8% -48.2%
Sept. 2006 550,000 -24.1% 33.2%
Aug. 2006 413,000 -32.8% -1.0%
July 2006 417,000 17.5% -45.1%
June 2006 760,000 90.0% -35.9%
May 2006 1,186,000 276.5% -15.0%
================================================================
Total
Ounces YOY% MOM%
================================================================
April 2006 1,395,000 190.6% 30.1%
March 2006 1,072,000 64.9% 8.0%
Feb. 2006 993,000 98.6% -10.9%
Jan. 2006 1,115,000 1.8% -48.0%
Dec. 2005 2,145,000 -18.2% 195.9%
Nov. 2005 725,000 47.2% 81.3%
Oct. 2005 400,000 25.0% -44.8%
Sept. 2005 725,000 25.0% 17.9%
Aug. 2005 615,000 97.7% 73.2%
July 2005 355,000 108.8% -11.3%
June 2005 400,000 -20.8% 27.0%
May 2005 315,000 -65.6% -34.4%
—————————————————————-
April 2005 480,000 -29.4% -26.2%
March 2005 650,000 86.8% 30.0%
Feb. 2005 500,000 -61.0% -54.3%
Jan. 2005 1,095,000 -21.4% -58.2%
================================================================
Total
Ounces YOY% MOM%
================================================================
Dec. 2004 2,622,500 32.1% 432.5%
Nov. 2004 492,500 33.1% 53.9%
Oct. 2004 320,000 -54.6% -44.8%
Sept. 2004 580,000 22.1% 86.5%
Aug. 2004 311,000 -41.9% 82.9%
July 2004 170,000 -39.3% -66.3%
June 2004 505,000 7.9% -44.8%
May 2004 914,500 273.3% 34.5%
—————————————————————-
April 2004 680,000 56.7% 95.4%
March 2004 348,000 -60.3% -72.8%
Feb. 2004 1,281,000 21.4% -8.0%
Jan. 2004 1,392,500 -19.3% -29.8%
Dec. 2003 1,985,000 -20.3% 436.5%
Nov. 2003 370,000 111.4% -47.6%
Oct. 2003 705,500 355.2% 48.5%
Sept. 2003 475,000 -13.6% -11.2%
================================================================
Total
Ounces YOY% MOM%
================================================================
Aug. 2003 535,000 -69.3% 91.1%
July 2003 280,000 -62.2% -40.2%
June 2003 468,000 -32.7% 91.0%
May 2003 245,000 -50.5% -43.5%
—————————————————————-
April 2003 434,000 -46.7% -50.5%
March 2003 876,000 9.9% -17.0%
Feb. 2003 1,055,000 16.6% -38.8%
Jan. 2003 1,725,000 88.8% -30.7%
Dec. 2002 2,490,000 73.3% 1322.9%
Nov. 2002 175,000 -83.0% 12.9%
Oct. 2002 155,000 -81.6% -71.8%
Sept. 2002 550,000 0.0% -68.5%
Aug. 2002 1,745,000 267.8% 135.8%
July 2002 740,000 18.5% 6.5%
June 2002 695,000 48.8% 40.4%
May 2002 495,000 16.2% -39.3%
================================================================
Total
Ounces YOY% MOM%
================================================================
April 2002 815,000 45.0% 2.3%
March 2002 797,000 1.4% -11.9%
Feb. 2002 905,000 6.9% -0.9%
Jan. 2002 913,500 17.2% -36.4%
Dec. 2001 1,436,500 -27.3% 39.3%
Nov. 2001 1,031,500 77.7% 22.3%
Oct. 2001 843,500 118.2% 53.4%
Sept. 2001 550,000 85.5% 15.9%
Aug. 2001 474,500 85.7% -24.0%
July 2001 624,500 25.0% 33.7%
June 2001 467,000 -36.8% 9.6%
May 2001 426,000 -53.9% -24.2%
—————————————————————-
April 2001 562,000 -30.1% -28.5%
March 2001 786,000 -7.7% -7.1%
Feb. 2001 846,500 4.7% 8.6%
Jan. 2001 779,500 -22.9% -60.5%
================================================================
Total
Ounces YOY% MOM%
================================================================
Dec. 2000 1,975,000 15.0% 240.2%
Nov. 2000 580,500 58.6% 50.2%
Oct. 2000 386,500 10.7% 30.4%
Sept. 2000 296,500 -57.3% 16.0%
Aug. 2000 255,500 -66.7% -48.8%
July 2000 499,500 -26.4% -32.4%
June 2000 738,500 -14.4% -20.2%
May 2000 925,000 16.8% 15.0%
—————————————————————-
April 2000 804,500 12.0% -5.5%
March 2000 851,500 18.6% 5.3%
Feb. 2000 808,500 442.6% -20.1%
Jan. 2000 1,011,500 -15.4% -41.1%
Dec. 1999 1,718,000 587.2% 369.4%
Nov. 1999 366,000 -42.4% 4.9%
Oct. 1999 349,000 -62.1% -49.7%
Sept. 1999 694,000 54.2% -9.6%
================================================================
Total
Ounces YOY% MOM%
================================================================
Aug. 1999 768,000 31.3% 13.2%
July 1999 678,500 384.6% -21.4%
June 1999 863,000 475.3% 9.0%
May 1999 792,000 93.2% 10.3%
—————————————————————-
April 1999 718,000 857.3% 0.0%
March 1999 718,000 395.2% 381.9%
Feb. 1999 149,000 49.0% -87.5%
Jan. 1999 1,195,000 159.8% 378.0%
Dec. 1998 250,000 -71.6% -60.6%
Nov. 1998 635,000 182.2% -31.0%
Oct. 1998 920,000 283.3% 104.4%
Sept. 1998 450,000 150.0% -23.1%
Aug. 1998 585,000 800.0% 317.9%
July 1998 140,000 -54.1% -6.7%
June 1998 150,000 -31.8% -63.4%
May 1998 410,000 54.7% 446.7%
================================================================
Total
Ounces YOY% MOM%
================================================================
April 1998 75,000 -73.8% -48.3%
March 1998 145,000 -3.3% 45.0%
Feb. 1998 100,000 -74.0% -78.3%
Jan. 1998 460,000 5.7% -47.7%
Dec. 1997 880,000 -34.5% 291.1%
Nov. 1997 225,000 -53.6% -6.3%
Oct. 1997 240,000 -4.0% 33.3%
Sept. 1997 180,000 71.4% 176.9%
Aug. 1997 65,000 -71.7% -78.7%
July 1997 305,000 306.7% 38.6%
June 1997 220,000 -15.4% -17.0%
May 1997 265,000 960.0% -7.3%
—————————————————————-
April 1997 286,000 63.4% 90.7%
March 1997 150,000 -63.7% -61.0%
Feb. 1997 385,000 413.3% -11.5%
Jan. 1997 435,000 1350.0% -67.6%
================================================================
Total
Ounces YOY% MOM%
================================================================
Dec. 1996 1,343,000 -28.4% 176.9%
Nov. 1996 485,000 56.5% 94.0%
Oct. 1996 250,000 400.0% 138.1%
Sept. 1996 105,000 -30.0% -54.3%
Aug. 1996 230,000 206.7% 206.7%
July 1996 75,000 -40.0% -71.2%
June 1996 260,000 92.6% 940.0%
May 1996 25,000 -86.5% -85.7%
—————————————————————-
April 1996 175,000 -30.0% -57.6%
March 1996 413,000 -21.3% 450.7%
Feb. 1996 75,000 -73.7% 150.0%
Jan. 1996 30,000 -95.2% -98.4%
Dec. 1995 1,875,000 -25.3% 504.8%
Nov. 1995 310,000 148.0% 520.0%
Oct. 1995 50,000 -77.8% -66.7%
Sept. 1995 150,000 n/a 100.0%
================================================================
Total
Ounces YOY% MOM%
================================================================
Aug. 1995 75,000 -80.0% -40.0%
July 1995 125,000 -45.7% -7.4%
June 1995 135,000 35.0% -27.0%
May 1995 185,000 -64.8% -26.0%
—————————————————————-
April 1995 250,000 42.9% -52.4%
March 1995 525,000 16.7% 84.2%
Feb. 1995 285,000 -17.4% -54.4%
Jan. 1995 625,000 30.2% -75.1%
Dec. 1994 2,510,500 188.6% 1908.4%
Nov. 1994 125,000 0.0% -44.4%
Oct. 1994 225,000 350.0% n/a
Sept. 1994 0 -100.0% -100.0%
Aug. 1994 375,000 -31.8% 63.0%
July 1994 230,000 -8.0% 130.0%
June 1994 100,000 -78.0% -81.0%
May 1994 525,000 5.0% 200.0%
================================================================
Total
Ounces YOY% MOM%
================================================================
April 1994 175,000 -58.8% -61.1%
March 1994 450,000 -11.8% 30.4%
Feb. 1994 345,000 -59.4% -28.1%
Jan. 1994 480,000 -41.8% -44.8%
Dec. 1993 870,000 -21.5% 596.0%
Nov. 1993 125,000 -80.0% 150.0%
Oct. 1993 50,000 -74.4% -89.6%
Sept. 1993 480,000 20.0% -12.7%
Aug. 1993 550,000 14.6% 120.0%
July 1993 250,000 -19.4% -45.1%
June 1993 455,000 51.7% -9.0%
May 1993 500,000 92.3% 17.6%
—————————————————————-
April 1993 425,000 37.1% -16.7%
================================================================
SOURCE: U.S. Mint
Societe Generale see silver outperforming gold in the second half of 2013.
Silver’s poor performance is despite still strong fundamentals. Even a small increase in store of wealth demand due to ongoing currency debasement will propel prices much higher.
Contrarian buyers continue to accumulate on this latest dip and silver will continue to protect from financial and economic dislocations.
No comments:
Post a Comment