
Today’s AM fix was USD 1,378.75, EUR 1,070.21 and GBP 908.39 per ounce.
Yesterday’s AM fix was USD 1,353.75, EUR 1,051.95 and GBP 890.86 per ounce.
Gold climbed $19.40 or 1.43% yesterday to $1,384.30/oz and silver finished 2% higher.
Silver’s recovery yesterday from being 10% lower at one stage to recouping these losses and then rising over 2% was very positive technically. The key reversal is leading some to postulate that we may have seen the bottom or are close to a bottom.

Spot Silver in USD, 3 Days, May 17, 20, 21 – (Bloomberg)
This theory is bolstered by the fact that the 10% losses were due to a handful of a very large trades in a low volume session in Asia, while silver’s subsequent 12% reversal to the upside came amid extremely high trading volume with silver trading volume 82% higher than the 100 day moving average on the COMEX.
Silver’s fall could have been related to the gyrating yen dollar price as some hedge funds and banks use proprietary trading systems and sharp losses in a leveraged yen dollar position could have led to forced liquidation of silver.
However, the scale of the 10% loss in the silver market, and only the silver market suffered such large losses, would suggest that it was not simply due to margin selling on yen speculation losses.
Rather, the scale of selling suggests one or two massive sellers, likely institutional, who were determined to force the silver price lower, possibly in order to close or buy back underwater short positions.
Resistance in silver during the period March 2008 to September 2010 was $20/oz and this level provided support overnight and is an important long term support level.
While paper gold and silver is being manipulated though the use of leveraged selling on commodity exchanges and other gold and silver investment vehicles are being liquidated – especially the ETFs, demand for physical gold and silver remains very robust as seen in high premiums internationally and lengthy waiting times for delivery.
The paper players have won the recent skirmishes but those who own gold and silver bullion and focus on the long term will win the price war.
The scale of demand from China and India continues to be underestimated and this demand has accelerated after the recent price weakness. Large buy orders from China, India and other Asian markets are pushing the physical premiums to record levels.

Spot Silver in USD, 2007-2013 – (Bloomberg)
India is paying a premium of nearly $40 per 10 gramme bars. Dubai buyers are paying a premium of $7-10 per kilogramme.
Turkey is reported to be paying a premium of $25 an ounce over spot prices.
Hong Kong and Singapore buyers are paying premium of $5 per ounce for gold bars.
Demand is not just very strong in Asia. Bullion coin and bar demand also remains very robust in the U.S. and in Europe where premiums have also risen.
Government mints in Australia, the U.S, Canada, South Africa, Austria and the UK are reporting soaring bullion coin demand and are having difficulty meeting the scale of demand.
Silver coins, in particular, are seeing rising premiums and delays in delivery.
Also little reported is the fact that refineries in Switzerland and elsewhere are also finding it hard to cope with the scale of international demand for gold and silver bars.
It is clear that the recent fall in gold and silver prices was triggered by speculative traders operating in the futures markets and to a lesser extent by more speculative buyers of ETFs.
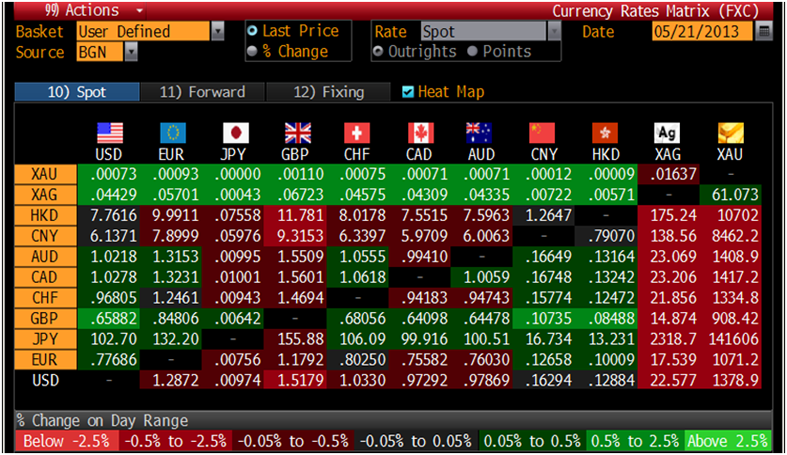
Cross Currency Table – (Bloomberg)
Their short-term view of generating a trading profit is in stark contrast to the views of long term investors and store of value buyers of gold and silver bullion, as evidenced by the massive wave of physical bullion buying that has been seen in the last month.
The smart money will again accumulate and dollar cost average into positions on the dip.
No comments:
Post a Comment