Friday, February 5, 2010

Unemployment – Model Is Broken

Unemployment statistics are flawed.

What have I been saying ever sine the recession began, the Bureau of Labor Statistics use of the "birth/death" model is flawed. To adjust the monthly jobs data by a number which is computed from a ‘model' of how many businesses were created and how many closed up during any given month is simply asking for trouble in maintaining any sense of accuracy.

The main purpose of the birth/death model is an attempt to offset the jobs data by what the BLS believes to be happening in the real world, the only problem is that the model relies on assumptions. And assumptions are worthless in an economic collapse.

When the Government releases Friday's employment report, nearly a million jobs could be erased. The change won't show up in the monthly report. Rather, the expected drop will show up in the government's revised job losses from April 2008 to March 2009, showing the labor market was in much worse shape than we knew at the time.(…)

Blame the birth/death model for the revision. Built on years of research, the model's key assumption is fairly simple: most of the time jobs created at new companies make up for losses at companies that close. In October, Keith Hall, Commissioner of the Bureau of Labor Statistics, said most of the coming revision "appears to be due in part to an increase in the number of business closings," short-circuiting the model's assumption that deaths are offset by births.(…)

The Labor Department says there are flaws in its models and its monthly employment survey but it defends the process, saying the annual employment revisions are small and stable. (…) (Source: Bloomberg)

Small and stable? I don't think a calculation error of 800,000 to 1 million additional job losses is ‘small and stable'.

The birth/death model should be shelved, permanently.

Debt fears rattle market

NEW YORK (CNNMoney.com) -- Fears about the fallout from a growing debt crisis in Europe dragged on Wall Street Thursday, sending the market to its lowest close in three months, with stocks hit across the board.

The Dow Jones industrial average (INDU) tumbled 268 points, or 2.6%, closing at 10,002.26, its lowest point since Nov. 4. The blue-chip briefly dipped below 10,000 late in the day, falling to that level for the first time since early November.

The Dow's decline marked the biggest one-day point loss since March 5 of last year.

The S&P 500 index (SPX) sank 34 points, or 3.1%, closing at the lowest point since Nov. 4. The one-day point loss was the biggest since April 20, 2009.

The Nasdaq composite (COMP) fell 65 points, or 3%, and closed at its lowest point point since Nov. 6. The one-day point loss was the largest since Feb. 10, 2009.

Debt woes propelled the dollar to a more than seven-month high versus the euro, which in turn pummeled dollar-traded commodities such as oil and gold. Treasury prices spiked, lowering yields, in a classic flight-to-safety move.

Meanwhile, the VIX (VIX), Wall Street's fear gauge, spiked almost 21%, suggesting investor nervousness was increasing.

"A surprise rise in weekly jobless claims ahead of tomorrow's non-farm payrolls report in combination with the sovereign debt issue has got people a bit spooked today," said Mikel Keifer, vice president at Jurika Mills & Keifer.

Keifer said concerns about Greece's debt problems have been in play for a while, but now Spain and Portugal are joining the fray.

Reports of labor unrest and political problems in the troubled nations are adding to the nervousness. "The worries are coming more to the forefront as market participants wonder if these countries will be able to refinance the debt," Keifer said.

The stronger dollar sent oil and gold prices lower, and stocks such as Chevron (CVX, Fortune 500) and Exxon Mobil (XOM, Fortune 500) sliding. With energy one of the biggest sectors in the S&P 500, the selloff in the sector dragged on the broader market.

Weaker-than-expected labor market reports on both Wednesday and Thursday also played a role, creating jitters ahead of Friday's January jobs report. Employers are expected to have added 15,000 jobs to their payrolls after cutting 85,000 in the previous month while the unemployment rate is expected to hold steady at 10%.

If the payrolls number varies dramatically, it will likely move the market one way or another. But short of that, markets are likely to remain focused on the debt issues, said Joe Clark, market analyst at Financial Enhancement Group.

"The big issue at hand right now is that these European countries are facing debt crises and no one is sure what kind of impact that may have on the global economy," Clark said.

Rally loses steam: Stocks rallied in the last 9 months of 2009 as investors dug back in after a brutal start to the year. The S&P 500 gained 65% between the 12-year lows hit on March 9 and year-end.

That advance continued up until around Jan. 19 of this year. But between that Jan. 19 high and the end of January, the S&P 500 lost just short of 7%.

"The market is in a pessimistic mood today, but this is also an extension of the correction we saw in late January," said Matt King, chief investment officer at Bell Investment Advisors. "We saw a 7% decline, but we probably need to see double-digits (in percentage) before the selloff is over."

Stock declines Thursday were broad based, with 29 of 30 Dow stocks falling. The exception was Cisco Systems, which reported strong quarterly results late Thursday.

Jobs: The number of Americans filing new claims for unemployment rose to 480,000 last week from a revised 472,000 the previous week, the Labor Department reported. Economists surveyed by Briefing.com expected 455,000 new claims.

Continuing claims, the number of Americans receiving benefits for a week or more, rose to 4,602,000 from 4,600,000 the previous week. Economists expected 4,581,000.

The report was the lead-in to Friday's big January jobs report from the government.

Beyond the monthly figures, investors will also take a look at the annual revision of U.S. payrolls. The Bureau of Labor Statistics is expected to say that 824,000 more jobs were lost than previously thought during the April 2008 to May 2009 period, indicating the recession was even deeper than had been thought.

Factory orders: December factory orders rose 1% versus forecasts for a rise of 0.5%. Orders rose 1% in the previous month.

Quarterly results: After the close of trading Wednesday, tech leader Cisco Systems (CSCO, Fortune 500) reported better-than-expected quarterly sales and earnings.

Toyota Motor (TM) reported improved earnings in its most recent quarter and also lifted its estimates for the fiscal year ending in March. But the results did not include the impact of the huge recall of millions of vehicles due to gas pedal problems. Toyota estimates that the global recall could cost it as much as $2 billion.

On Thursday, the government announced a formal probe into brake problems in the popular Prius hybrid. (Feds probing Prius brakes)

World markets: In overseas trading, Asian markets tumbled and European markets ended lower.

Commodities and the dollar: The dollar gained versus the euro on worries about sovereign debt in Greece, Spain and elsewhere in Europe. The dollar fell versus the Japanese yen.

The dollar's strength against the euro dragged on oil and gold prices and individual stocks.

COMEX gold for April delivery fell $49 to settle at $1,062.40 an ounce.

U.S. light crude oil for March delivery fell $3.84 to settle at $73.14 a barrel on the New York Mercantile Exchange.

Bonds: Treasury prices rallied, lowering the yield on the 10-year note to 3.61% from 3.70% late Wednesday. Treasury prices and yields move in opposite directions.

Market breadth was negative. On the New York Stock Exchange, losers beat winners by over ten to one on volume of 1.48 billion shares. On the Nasdaq, decliners topped advancers by more than six to one on volume of 2.84 billion shares. To top of page

Your Neighbor is being foreclosed on but you don’t know it. 3 Identical Homes on the Same Street Telling us a Very Different Story Each.....

People love to overpay for homes in California. It seems to be a rite of passage. Even if it meant that someone needed to go into a property with the leverage only available through an Alt-A or option ARM toxic loan. People don’t get that some cities still have a tremendous amount of shadow inventory and that prices will come down unless the economy improves and improves significantly. Yet I understand that statistics don’t drill down into the personal reality of what is happening on the ground. So today, I will show you that all in one block (3 nearly identical homes in size and room) we have shadow inventory, an overpriced home, and a rental reflecting the realities of what homes are really worth.

Today we salute you Cerritos with our Real Home of Genius Award.

The Home for Sale in Cerritos

Cerritos currently has a median home sale price of $610,000. This is simply absurd given that the average household income is $89,000. This is the prime example of a shadow inventory city. Each shadow inventory city has a unique attribute that people think is unique to the area. Pasadena has the idea of the Rose Bowl and the allure of it being close to L.A. and Cerritos has the draw of quality schools. But that in itself does not sustain an area if incomes don’t match up to housing values.

The above home is 1,106 square feet with 3 bedrooms and 1 bath. It has been listed on the MLS for 9 days. The current list price is $549,000 so if you look at the city median price, this seems to be in line with that figure. But again, this is simply another area that is in a deep bubble and will correct in the next year or two. Why?

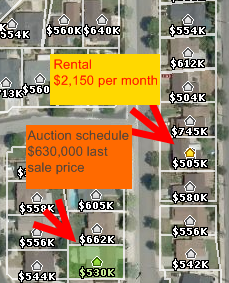
Because only a few houses down, we have a home that is scheduled for auction and a rental that shows a very different market:

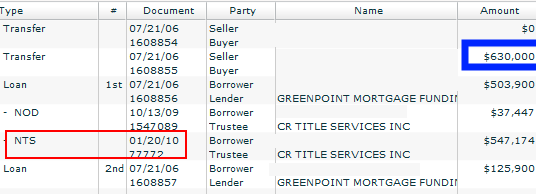
Let us first look at the home that is part of the shadow inventory. The data on the home scheduled for auction is nearly identical with the home that is for sale. It is a 3 bedroom and 1 bath home. It is listed at 1,100 square feet so this area seems to be a suburban box neighborhood where many homes are built nearly the same way. The home for sale was built in 1969 and this foreclosed home was built in 1970. Let us look at what occurred on this property:

This home was bought during the peak of insanity for $630,000 in 2006. This was a 100 percent financing deal. They took out a first mortgage of $503,900 and a second of $125,900. Greenpoint Mortgage by the way was a toxic mortgage superstar. So now after three years the home is scheduled for auction. When the notice of default was filed in October of last year the borrower was already behind by $37,447. The auction was only scheduled a couple of weeks ago. This home is nowhere to be found on the public view. Keep in mind a few houses down the other home above is being sold for $549,000.

You can see the problem already growing. This home if it were to be added to the inventory would add pressure to the price of the other home. Clearly the current borrowers have stopped making their payments. So who really knows where this is at but this is a clear case of shadow inventory.

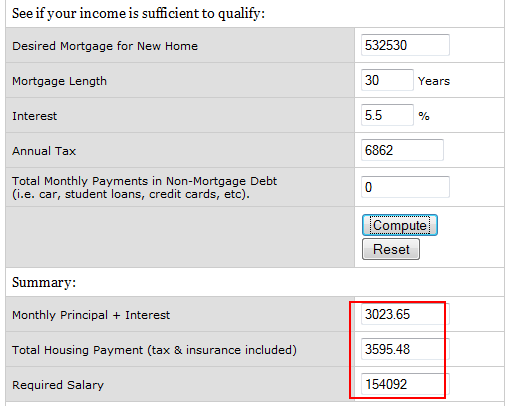
But let us run the numbers on that $549,000 home if we go with 3.5% down and a wonderful FHA insured loan:

First, you will need a household income of $154,000 (nearly twice the average for the city) to qualify for the loan. Next, your monthly housing payment (PITI) is going to come out to be $3,600. But did you notice that the above rental is going for $2,150? You are paying 40 percent more per month to own the home ($1,450 more per month). This is insanity. It will always be more expensive to own, that is correct. But nothing like this. In other words, this area is in a gigantic bubble. Keep in mind your total housing payment is coming out of your net income. All your wonderful tax subsidies and breaks come at the end of the year when you file your taxes. The rental rate is more reflective of the actual local market because it is subsidy free and what a local area renter is able and willing to pay out of their net income.

Let us now look at the rental:

The rental is identical in size to the other two homes. A 3 bedrooms and 1.75 bath home listed at 1,100 square feet. This is an excellent example of what is going on because we have virtually three identical homes all in the same block but telling us very different stories. You would have to be out of your mind to pay the current price. You would be buying at a peak low in mortgage rates in an area that can clearly only support a rental income of $2,150. Think about that. No investor in their right mind would pay this amount. And rates will go up. Just look what happened to the markets today once people realize a country can’t pay their debt (hello California!). If you bought this home as an investor, you would be negative cash flowing by over $1,000 per month depending on your down payment. That would be a dumb move right off the bat and keep in mind, for investment properties the interest rate is much higher and you have to go in with at least 20 percent down. This is why I believe we are far from a bottom in many markets that are filled with shadow inventory. And let us run those numbers.

Cerritos in our last month of data had 21 homes sell. The MLS has 49 homes listed. Not bad right? After all, that is about 2 months of inventory. But let us run the shadow inventory numbers:

Notice of defaults: 83

Auction Scheduled: 143

Bank owned: 16

242 homes in the shadow inventory versus 49 homes on the MLS. In other words, you would be speculating into a bubble area right now if you decided to buy.

It Is Now Mathematically Impossible To Pay Off The U.S. National Debt

A lot of people are very upset about the rapidly increasing U.S. national debt these days and they are demanding a solution. What they don't realize is that there simply is not a solution under the current U.S. financial system. It is now mathematically impossible for the U.S. government to pay off the U.S. national debt. You see, the truth is that the U.S. government now owes more dollars than actually exist. If the U.S. government went out today and took every single penny from every single American bank, business and taxpayer, they still would not be able to pay off the national debt. And if they did that, obviously American society would stop functioning because nobody would have any money to buy or sell anything.

And the U.S. government would still be massively in debt.

So why doesn't the U.S. government just fire up the printing presses and print a bunch of money to pay off the debt?

Well, for one very simple reason.

That is not the way our system works.

You see, for more dollars to enter the system, the U.S. government has to go into more debt.

The U.S. government does not issue U.S. currency - the Federal Reserve does.

The Federal Reserve is a private bank owned and operated for profit by a very powerful group of elite international bankers.

If you will pull a dollar bill out and take a look at it, you will notice that it says "Federal Reserve Note" at the top.

It belongs to the Federal Reserve.

The U.S. government cannot simply go out and create new money whenever it wants under our current system.

Instead, it must get it from the Federal Reserve.

So, when the U.S. government needs to borrow more money (which happens a lot these days) it goes over to the Federal Reserve and asks them for some more green pieces of paper called Federal Reserve Notes.

The Federal Reserve swaps these green pieces of paper for pink pieces of paper called U.S. Treasury bonds. The Federal Reserve either sells these U.S. Treasury bonds or they keep the bonds for themselves (which happens a lot these days).

So that is how the U.S. government gets more green pieces of paper called "U.S. dollars" to put into circulation. But by doing so, they get themselves into even more debt which they will owe even more interest on.

So every time the U.S. government does this, the national debt gets even bigger and the interest on that debt gets even bigger.

Are you starting to get the picture?

As you read this, the U.S. national debt is approximately 12 trillion dollars, although it is going up so rapidly that it is really hard to pin down an exact figure.

So how much money actually exists in the United States today?

Well, there are several ways to measure this.

The "M0" money supply is the total of all physical bills and currency, plus the money on hand in bank vaults and all of the deposits those banks have at reserve banks. As of mid-2009, the Federal Reserve said that this amount was about 908 billion dollars.

The "M1" money supply includes all of the currency in the "M0" money supply, along with all of the money held in checking accounts and other checkable accounts at banks, as well as all money contained in travelers' checks. According to the Federal Reserve, this totaled approximately 1.7 trillion dollars in December 2009, but not all of this money actually "exists" as we will see in a moment.

The "M2" money supply includes everything in the "M1" money supply plus most other savings accounts, money market accounts, retail money market mutual funds, and small denomination time deposits (certificates of deposit of under $100,000). According to the Federal Reserve, this totaled approximately 8.5 trillion dollars in December 2009, but once again, not all of this money actually "exists" as we will see in a moment.

The "M3" money supply includes everything in the "M2" money supply plus all other CDs (large time deposits and institutional money market mutual fund balances), deposits of eurodollars and repurchase agreements. The Federal Reserve does not keep track of M3 anymore, but according to ShadowStats.com it is currently somewhere in the neighborhood of 14 trillion dollars. But again, not all of this "money" actually "exists" either.

So why doesn't it exist?

It is because our financial system is based on something called fractional reserve banking.

When you go over to your local bank and deposit $100, they do not keep your $100 in the bank. Instead, they keep only a small fraction of your money there at the bank and they lend out the rest to someone else. Then, if that person deposits the money that was just borrowed at the same bank, that bank can loan out most of that money once again. In this way, the amount of "money" quickly gets multiplied. But in reality, only $100 actually exists. The system works because we do not all run down to the bank and demand all of our money at the same time.

According to the New York Federal Reserve Bank, fractional reserve banking can be explained this way....

"If the reserve requirement is 10%, for example, a bank that receives a $100 deposit may lend out $90 of that deposit. If the borrower then writes a check to someone who deposits the $90, the bank receiving that deposit can lend out $81. As the process continues, the banking system can expand the initial deposit of $100 into a maximum of $1,000 of money ($100+$90+81+$72.90+...=$1,000)."

So much of the "money" out there today is basically made up out of thin air.

In fact, most banks have no reserve requirements at all on savings deposits, CDs and certain kinds of money market accounts. Primarily, reserve requirements apply only to "transactions deposits" – essentially checking accounts.

The truth is that banks are freer today to dramatically "multiply" the amounts deposited with them than ever before. But all of this "multiplied" money is only on paper - it doesn't actually exist.

The point is that the broadest measures of the money supply (M2 and M3) vastly overstate how much "real money" actually exists in the system.

So if the U.S. government went out today and demanded every single dollar from all banks, businesses and individuals in the United States it would not be able to collect 14 trillion dollars (M3) or even 8.5 trillion dollars (M2) because those amounts are based on fractional reserve banking.

So the bottom line is this....

#1) If all money owned by all American banks, businesses and individuals was gathered up today and sent to the U.S. government, there would not be enough to pay off the U.S. national debt.

#2) The only way to create more money is to go into even more debt which makes the problem even worse.

You see, this is what the whole Federal Reserve System was designed to do. It was designed to slowly drain the massive wealth of the American people and transfer it to the elite international bankers.

It is a game that is designed so that the U.S. government cannot win. As soon as they create more money by borrowing it, the U.S. government owes more than what was created because of interest.

If you owe more money than ever was created you can never pay it back.

That means perpetual debt for as long as the system exists.

It is a system designed to force the U.S. government into ever-increasing amounts of debt because there is no escape.

Of course if we had listened to our very wise founding father Thomas Jefferson, we could have avoided this colossal mess in the first place....

"If the American people ever allow private banks to control the issue of their money, first by inflation and then by deflation, the banks and corporations that will grow up around them (around the banks), will deprive the people of their property until their children will wake up homeless on the continent their fathers conquered."

But we didn't listen, did we?

We could solve this problem by shutting down the Federal Reserve and restoring the power to issue U.S. currency to the U.S. Congress (which is what the U.S. Constitution calls for). But the politicians in Washington D.C. are not about to do that.

So unless you are willing to fundamentally change the current system, you might as well quit complaining about the U.S. national debt because it is now mathematically impossible to pay it off.

Gerald Celente on Coast to Coast AM "The Crash of 2010 is Coming"

Click this link ..... http://eclipptv.com/viewVideo.php?video_id=9850

Hyper Deflation Scenario

Click this link ....... http://eclipptv.com/viewVideo.php?video_id=9840

Rising tension between China & United States

Click this link ....... http://eclipptv.com/viewVideo.php?video_id=9848